## Charts: Knowledge Evolution Metrics
### Overview
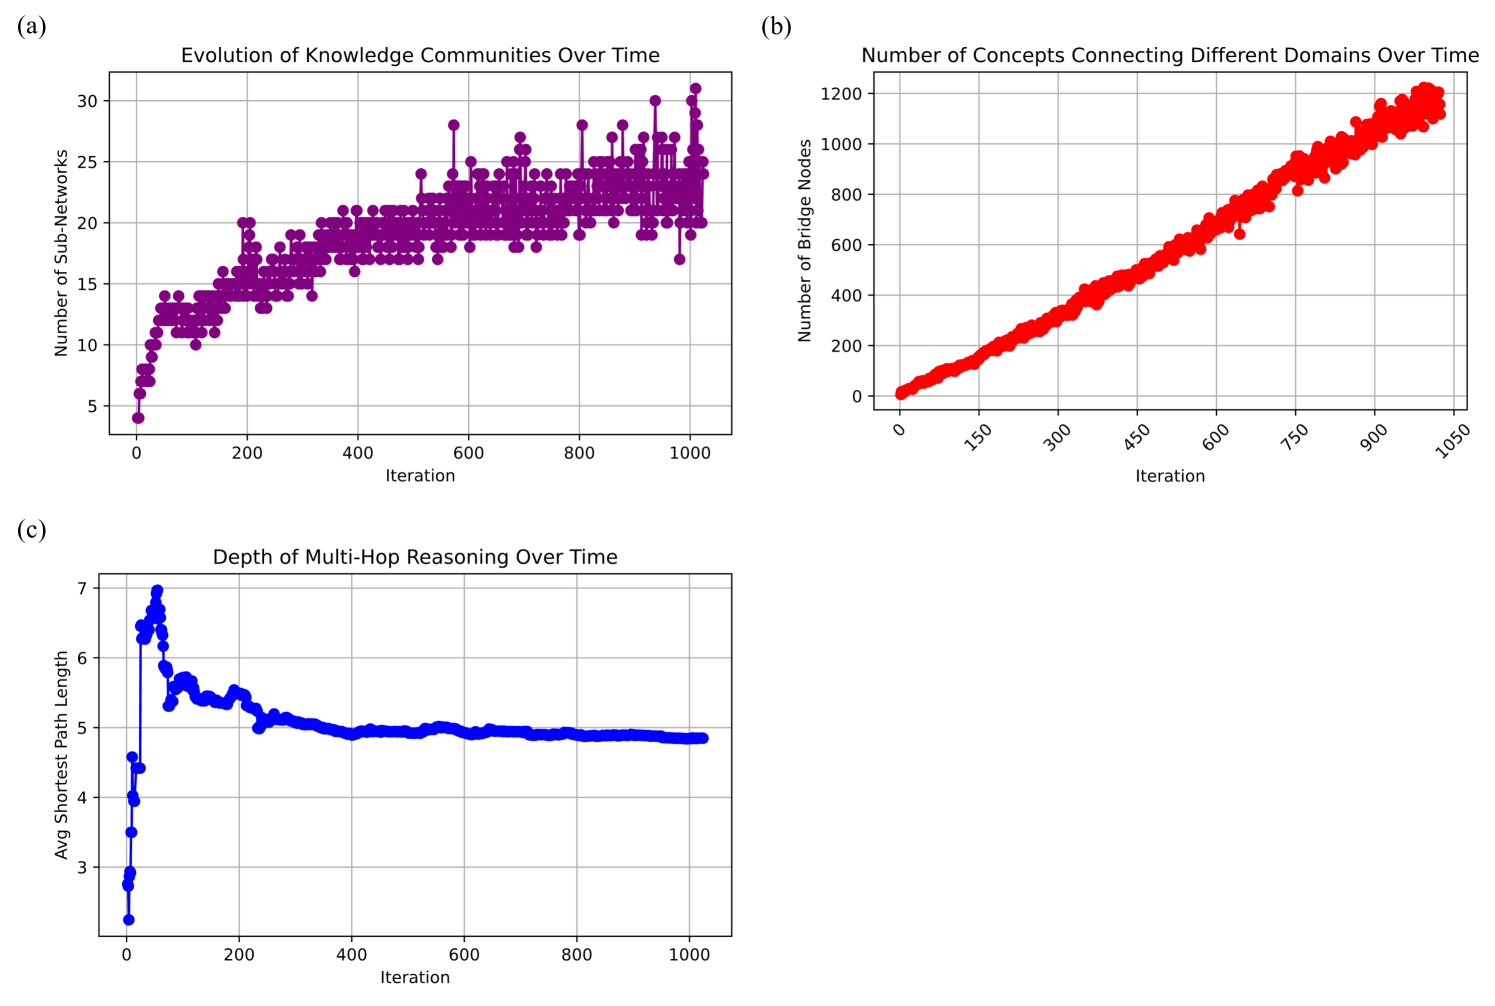
The image presents three separate time-series charts illustrating the evolution of knowledge communities, concept connections, and multi-hop reasoning depth over iterations. Each chart displays a different metric against the 'Iteration' variable, ranging from 0 to 1000.
### Components/Axes
Each chart shares the following components:
* **X-axis:** Labeled "Iteration", ranging from 0 to 1000, with tick marks every 100 units.
* **Y-axis:** Each chart has a unique Y-axis label and scale, as detailed below.
* **Data Series:** Each chart features a single data series represented by a line with associated markers.
**Chart (a): Evolution of Knowledge Communities Over Time**
* **Y-axis:** Labeled "Number of Sub-Networks", ranging from 0 to 30, with tick marks every 5 units.
* **Data Series Color:** Magenta/Purple.
**Chart (b): Number of Concepts Connecting Different Domains Over Time**
* **Y-axis:** Labeled "Number of Bridge Nodes", ranging from 0 to 1200, with tick marks every 200 units.
* **Data Series Color:** Red.
**Chart (c): Depth of Multi-Hop Reasoning Over Time**
* **Y-axis:** Labeled "Avg Shortest Path Length", ranging from 3 to 7, with tick marks every 1 unit.
* **Data Series Color:** Blue.
### Detailed Analysis or Content Details
**Chart (a): Evolution of Knowledge Communities Over Time**
The magenta line shows an upward trend, initially steep, then leveling off.
* At Iteration 0, the Number of Sub-Networks is approximately 7.
* At Iteration 200, the Number of Sub-Networks is approximately 15.
* At Iteration 400, the Number of Sub-Networks is approximately 20.
* At Iteration 600, the Number of Sub-Networks is approximately 24.
* At Iteration 800, the Number of Sub-Networks is approximately 27.
* At Iteration 1000, the Number of Sub-Networks is approximately 26.
There is significant fluctuation around the 25-28 range between iterations 600 and 1000.
**Chart (b): Number of Concepts Connecting Different Domains Over Time**
The red line exhibits a strong, nearly linear upward trend.
* At Iteration 0, the Number of Bridge Nodes is approximately 50.
* At Iteration 150, the Number of Bridge Nodes is approximately 200.
* At Iteration 300, the Number of Bridge Nodes is approximately 400.
* At Iteration 450, the Number of Bridge Nodes is approximately 600.
* At Iteration 600, the Number of Bridge Nodes is approximately 800.
* At Iteration 750, the Number of Bridge Nodes is approximately 950.
* At Iteration 900, the Number of Bridge Nodes is approximately 1100.
* At Iteration 1050, the Number of Bridge Nodes is approximately 1200.
**Chart (c): Depth of Multi-Hop Reasoning Over Time**
The blue line shows a downward trend, initially steep, then gradually flattening.
* At Iteration 0, the Avg Shortest Path Length is approximately 3.2.
* At Iteration 200, the Avg Shortest Path Length is approximately 5.2.
* At Iteration 400, the Avg Shortest Path Length is approximately 4.5.
* At Iteration 600, the Avg Shortest Path Length is approximately 4.0.
* At Iteration 800, the Avg Shortest Path Length is approximately 3.7.
* At Iteration 1000, the Avg Shortest Path Length is approximately 3.6.
### Key Observations
* Chart (a) shows the number of knowledge communities increasing initially, then stabilizing with some fluctuations.
* Chart (b) demonstrates a consistent and substantial increase in the number of concepts connecting different domains.
* Chart (c) indicates a decrease in the average shortest path length, suggesting improved multi-hop reasoning capabilities.
### Interpretation
These charts collectively suggest a system undergoing a learning or evolution process. The increasing number of sub-networks (Chart a) indicates a growing complexity and diversification of knowledge. Simultaneously, the increasing number of bridge nodes (Chart b) suggests that these communities are becoming increasingly interconnected, fostering cross-domain knowledge transfer. The decreasing average shortest path length (Chart c) implies that the system is becoming more efficient at reasoning across multiple hops, potentially leading to more insightful and comprehensive understanding.
The stabilization of sub-networks after iteration 600 could indicate a saturation point in community formation, while the continued growth of bridge nodes suggests ongoing integration of knowledge. The flattening of the shortest path length curve suggests diminishing returns in reasoning efficiency, potentially indicating a limit to how much further the system can optimize its reasoning capabilities. The data suggests a system that is becoming more complex, interconnected, and efficient in its reasoning over time.