## Scatter Plot Series: Evolution of a Knowledge Network
### Overview
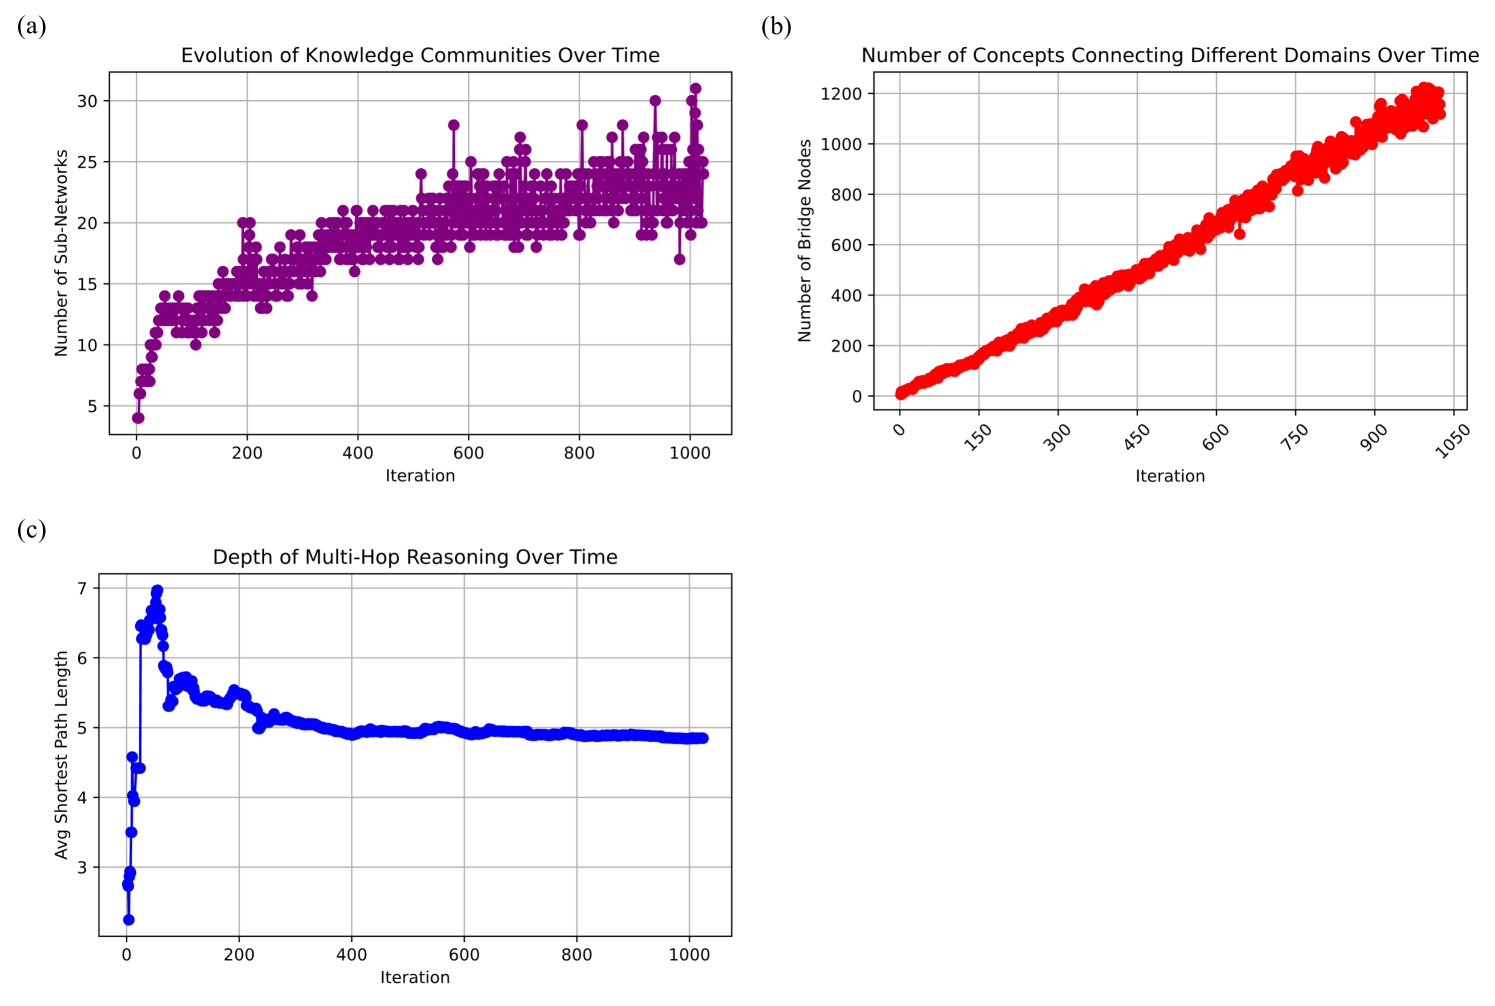
The image contains three distinct scatter plots, labeled (a), (b), and (c), arranged in a 2x2 grid with the bottom-right quadrant empty. Each plot tracks a different metric of a system's evolution over "Iteration" (x-axis). The plots use different colors for their data points: purple for (a), red for (b), and blue for (c). There is no overarching legend; each plot's color is intrinsically tied to its specific metric.
### Components/Axes
**Common Elements:**
* **X-Axis (All Plots):** Labeled "Iteration". The scale runs from 0 to approximately 1000 or 1050.
* **Grid:** All plots feature a light gray grid for easier value estimation.
**Plot (a) - Top Left:**
* **Title:** "Evolution of Knowledge Communities Over Time"
* **Y-Axis Label:** "Number of Sub-Networks"
* **Y-Axis Scale:** Linear, from 0 to 30, with major ticks every 5 units.
* **Data Color:** Purple.
**Plot (b) - Top Right:**
* **Title:** "Number of Concepts Connecting Different Domains Over Time"
* **Y-Axis Label:** "Number of Bridge Nodes"
* **Y-Axis Scale:** Linear, from 0 to 1200, with major ticks every 200 units.
* **Data Color:** Red.
**Plot (c) - Bottom Left:**
* **Title:** "Depth of Multi-Hop Reasoning Over Time"
* **Y-Axis Label:** "Avg Shortest Path Length"
* **Y-Axis Scale:** Linear, from 2 to 7, with major ticks every 1 unit.
* **Data Color:** Blue.
### Detailed Analysis
**Plot (a): Evolution of Knowledge Communities**
* **Trend Verification:** The purple data points show a rapid, near-vertical increase from ~4 to ~14 sub-networks within the first ~50 iterations. The growth then decelerates, forming a noisy, upward-sloping plateau. From iteration ~200 onward, the number of sub-networks fluctuates heavily between approximately 18 and 28, with a central tendency that slowly rises from ~20 to ~24 by iteration 1000.
* **Key Data Points (Approximate):**
* Iteration 0: ~4 sub-networks
* Iteration 50: ~14 sub-networks
* Iteration 200: ~20 sub-networks (with high variance)
* Iteration 1000: ~24 sub-networks (range: ~18-28)
**Plot (b): Number of Connecting Concepts**
* **Trend Verification:** The red data points exhibit a remarkably consistent, near-linear upward trend with very low variance. The line of points has a constant positive slope, indicating steady growth.
* **Key Data Points (Approximate):**
* Iteration 0: ~0 bridge nodes
* Iteration 150: ~200 bridge nodes
* Iteration 450: ~600 bridge nodes
* Iteration 750: ~900 bridge nodes
* Iteration 1050: ~1200 bridge nodes
**Plot (c): Depth of Multi-Hop Reasoning**
* **Trend Verification:** The blue data points show a dramatic, sharp spike at the very beginning, reaching a peak. This is followed by a rapid decline and then a long, stable plateau with minimal fluctuation.
* **Key Data Points (Approximate):**
* Iteration 0: ~2.5 avg shortest path length
* Peak (Iteration ~20): ~7.0
* Iteration 100: ~5.5
* Iteration 200: ~5.2
* Iteration 400 to 1000: Stable at ~4.9 to 5.0
### Key Observations
1. **Divergent Growth Patterns:** The three metrics evolve in fundamentally different ways. "Bridge Nodes" (b) grow linearly and predictably. "Sub-Networks" (a) grow logistically with high noise. "Avg Shortest Path Length" (c) exhibits a transient spike before stabilizing.
2. **Phase Change in Reasoning Depth:** Plot (c) clearly shows two distinct phases: an initial exploration phase where reasoning paths become very deep (high avg shortest path length), followed by an optimization phase where the network reorganizes to maintain shorter, more efficient paths.
3. **Noise vs. Signal:** Plot (a) is characterized by high-frequency noise (large vertical scatter), suggesting the number of sub-networks is a volatile metric. In contrast, plots (b) and (c) show much tighter data point clustering, indicating more stable, deterministic growth in those metrics.
4. **Temporal Correlation:** The initial spike in reasoning depth (c, iterations 0-100) coincides with the period of fastest growth in sub-networks (a) and the beginning of bridge node accumulation (b). The stabilization of reasoning depth (c, after iteration ~200) occurs as the growth of sub-networks (a) enters its noisy plateau phase.
### Interpretation
This data collectively narrates the evolution of a growing knowledge or concept network. The process appears to follow a logical sequence:
1. **Initial Fragmentation & Exploration (Iterations 0-100):** The system rapidly generates many distinct sub-networks (a) and simultaneously explores deep, complex connections between concepts, leading to a spike in average path length (c). This is the "brainstorming" or "specialization" phase.
2. **Integration & Optimization (Iterations 100-400):** The rate of new sub-network creation slows. The system focuses on building bridges between existing domains (b continues its steady climb). Crucially, it optimizes its internal structure, drastically reducing the average reasoning path length (c) from its peak. This suggests the formation of more direct, efficient links between previously distant concepts.
3. **Steady-State Growth (Iterations 400+):** The network reaches a dynamic equilibrium. The number of communities (a) fluctuates around a slowly increasing mean, indicating ongoing reorganization. The number of interdisciplinary bridges (b) continues its relentless linear growth, showing constant integration. The reasoning depth (c) remains stable and low, indicating the network has achieved an efficient "small-world" property where most concepts are connected via short paths.
**In essence, the system evolves from a fragmented, deep, and inefficient state into an integrated, optimized, and scalable network.** The linear growth of bridge nodes is the most robust indicator of ongoing interdisciplinary synthesis, while the stabilization of path length confirms the network's maturation into an efficient knowledge structure. The noise in sub-network count may reflect the dynamic competition and merging of ideas within the system.