## Composite Graphs: Evolution Metrics Over Iterations
### Overview
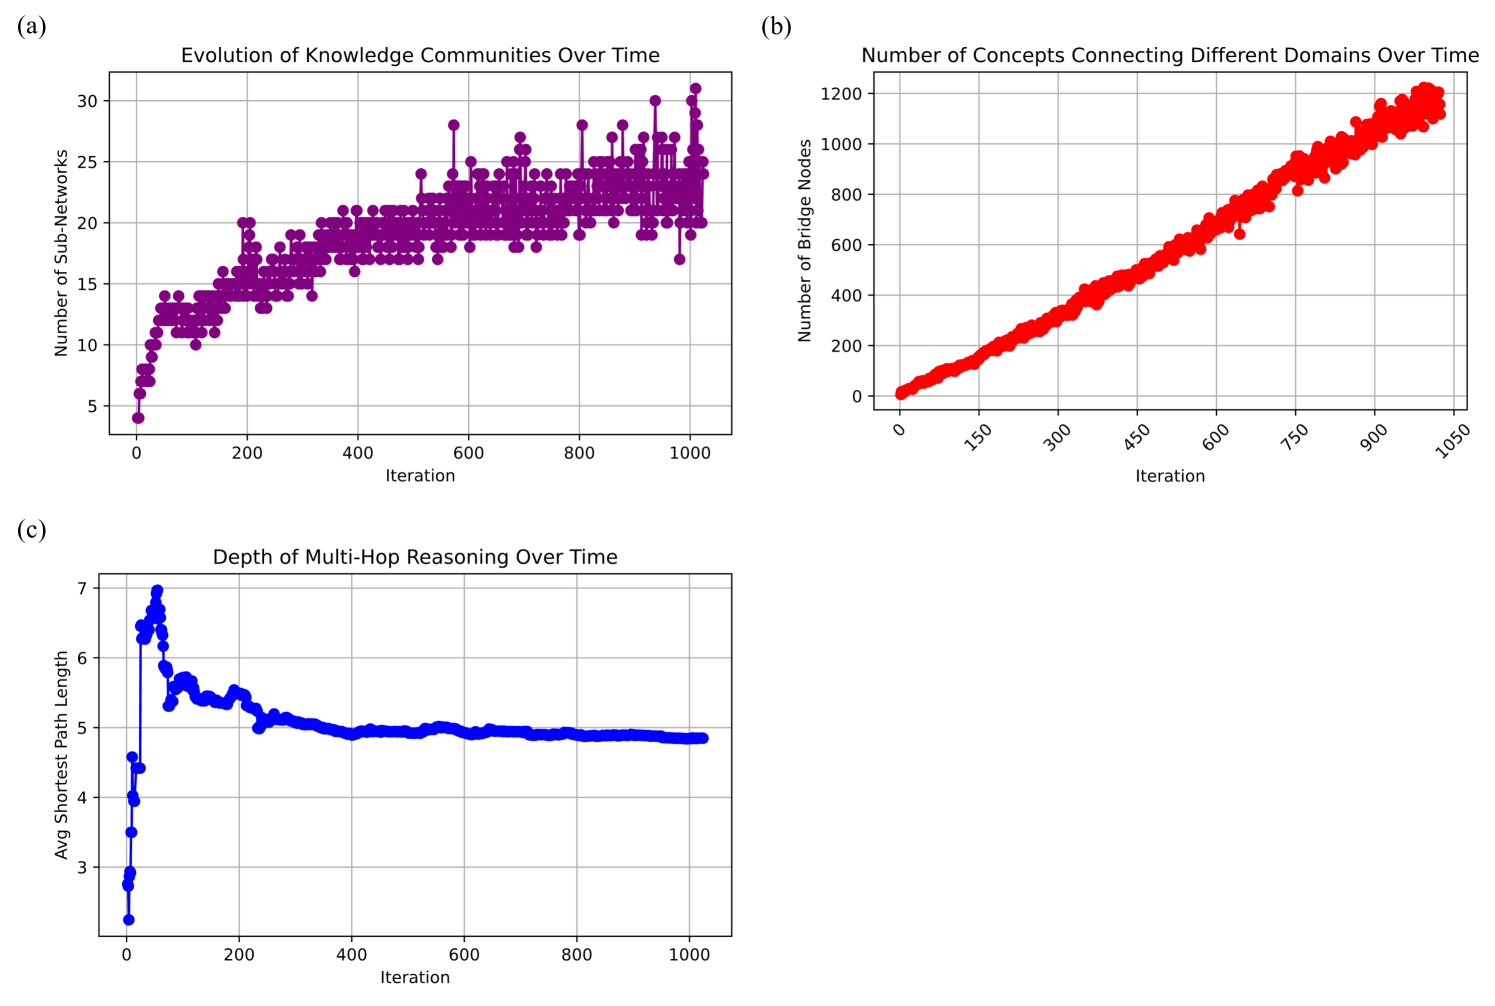
The image contains three distinct line/scatter plots arranged in a 2x2 grid (with the bottom-right quadrant empty). Each plot tracks a different metric across iterations, using distinct colors for data points: purple (a), red (b), and blue (c).
---
### Components/Axes
#### (a) Evolution of Knowledge Communities Over Time
- **Y-axis**: "Number of Sub-Networks" (0–30, linear scale)
- **X-axis**: "Iteration" (0–1000, linear scale)
- **Data**: Purple dots with error bars (vertical only).
#### (b) Number of Concepts Connecting Different Domains Over Time
- **Y-axis**: "Number of Bridge Nodes" (0–1200, linear scale)
- **X-axis**: "Iteration" (0–1050, linear scale)
- **Data**: Red dots with no error bars.
#### (c) Depth of Multi-Hop Reasoning Over Time
- **Y-axis**: "Avg Shortest Path Length" (2–7, linear scale)
- **X-axis**: "Iteration" (0–1000, linear scale)
- **Data**: Blue dots with error bars (vertical only).
---
### Detailed Analysis
#### (a) Evolution of Knowledge Communities Over Time
- **Trend**: Initial exponential growth (0–200 iterations: 4 → ~18 sub-networks), followed by stabilization (~20–25 sub-networks) with minor fluctuations.
- **Key Data Points**:
- Iteration 0: ~4 sub-networks.
- Peak at ~28 sub-networks (iteration ~600).
- Final value (~1000 iterations): ~22 sub-networks.
#### (b) Number of Concepts Connecting Different Domains Over Time
- **Trend**: Linear growth with slight acceleration.
- **Key Data Points**:
- Iteration 0: ~0 bridge nodes.
- Iteration 500: ~600 bridge nodes.
- Iteration 1000: ~1200 bridge nodes.
#### (c) Depth of Multi-Hop Reasoning Over Time
- **Trend**: Sharp initial decline (0–100 iterations: ~7 → ~5 path length), followed by stabilization (~5 path length).
- **Key Data Points**:
- Iteration 0: ~7 path length.
- Iteration 100: ~5.2 path length.
- Iteration 1000: ~5.0 path length.
---
### Key Observations
1. **Stabilization vs. Growth**:
- Sub-networks (a) and reasoning depth (c) stabilize after initial changes, while bridge nodes (b) show continuous growth.
2. **Temporal Dynamics**:
- Knowledge communities (a) and reasoning efficiency (c) reach equilibrium by ~600–1000 iterations.
- Inter-domain connections (b) scale linearly without plateau.
3. **Error Bars**:
- Present in (a) and (c), indicating measurement uncertainty (e.g., ±1–2 sub-networks in (a)).
---
### Interpretation
1. **Knowledge Community Dynamics**:
- The stabilization of sub-networks (a) suggests a self-organizing system reaching capacity, while bridge nodes (b) imply increasing interdisciplinary integration over time.
2. **Reasoning Efficiency**:
- The drop in average path length (c) indicates improved connectivity or optimization in reasoning pathways early in the process.
3. **System Behavior**:
- The divergence between stabilizing metrics (a, c) and growing metrics (b) may reflect a trade-off between internal complexity (sub-networks) and external integration (bridge nodes).
---
**Note**: No legends or textual annotations beyond axis labels are present. Colors are used consistently across plots but lack explicit legends. All values are approximate, with uncertainty inferred from error bars and visual spread.