## Line Graph: Model Accuracy vs. Sample Size
### Overview
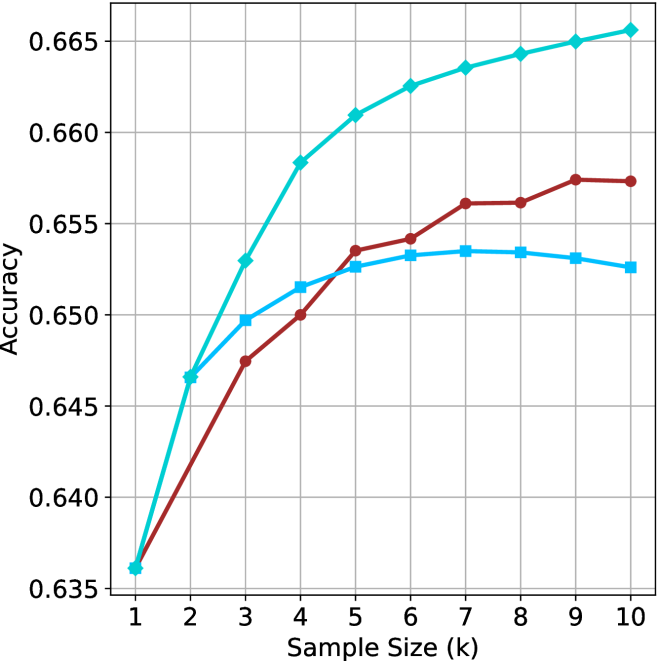
The image depicts a line graph comparing the accuracy of three models (Model A, Model B, Model C) across varying sample sizes (k = 1 to 10). Accuracy is measured on the y-axis (0.635–0.665), while the x-axis represents sample size. All three models show increasing accuracy with larger sample sizes, but their growth rates and final performance differ.
### Components/Axes
- **X-axis**: "Sample Size (k)" with integer markers from 1 to 10.
- **Y-axis**: "Accuracy" with decimal markers from 0.635 to 0.665.
- **Legend**: Located in the top-right corner, associating:
- Teal line → "Model A"
- Red line → "Model B"
- Blue line → "Model C"
### Detailed Analysis
1. **Model A (Teal Line)**:
- Starts at **0.635** when k=1.
- Increases steadily, reaching **0.665** at k=10.
- Slope is consistently upward, with no plateaus.
2. **Model B (Red Line)**:
- Begins at **0.635** (k=1).
- Sharp rise to **0.655** by k=3.
- Plateaus between k=3 and k=10, maintaining **~0.655–0.657** accuracy.
3. **Model C (Blue Line)**:
- Starts at **0.635** (k=1).
- Gradual increase to **~0.652** at k=10.
- Slope is less steep than Model A but steeper than Model B after k=5.
### Key Observations
- **Model A** achieves the highest accuracy across all sample sizes, particularly dominant at larger k (e.g., 0.665 vs. 0.657 for Model B at k=10).
- **Model B** shows rapid early improvement but stagnates after k=3, suggesting diminishing returns.
- **Model C** exhibits the slowest growth but maintains consistent upward trends without plateaus.
- No lines intersect, indicating no model overtakes another in performance after their initial trajectories.
### Interpretation
The data suggests that **larger sample sizes improve model accuracy**, with **Model A** being the most effective overall. Model B’s early gains but subsequent plateau imply it may be optimized for smaller datasets, while Model C’s steady growth indicates robustness but lower efficiency. The absence of crossing lines confirms that performance hierarchies remain stable across sample sizes. This could inform resource allocation: prioritize Model A for large-scale tasks, Model B for small datasets, and Model C for scenarios requiring gradual improvement.