## Chart: Posterior Mean and Credible Interval vs. Number of Consecutive Successes
### Overview
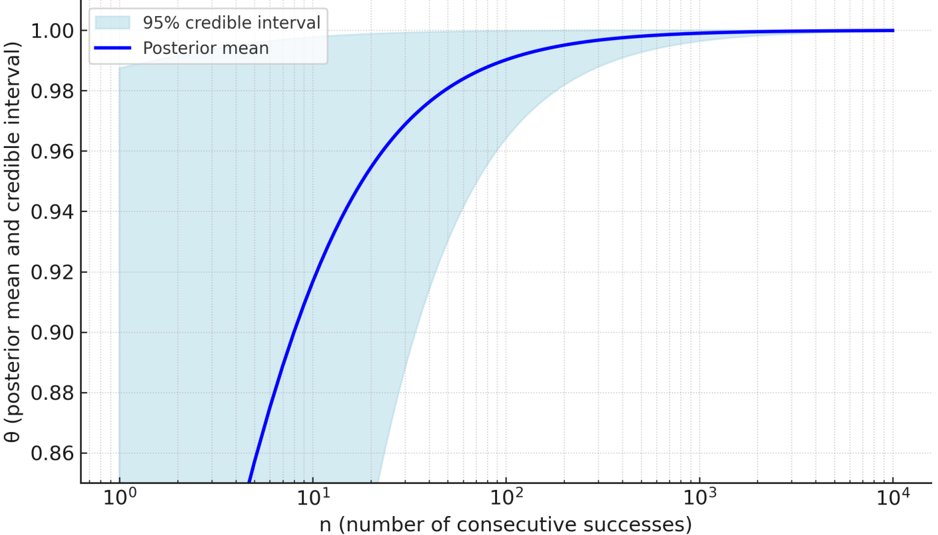
The image is a line chart showing the posterior mean and 95% credible interval as a function of the number of consecutive successes. The x-axis represents the number of consecutive successes on a logarithmic scale, ranging from 10^0 to 10^4. The y-axis represents the posterior mean and credible interval, ranging from 0.86 to 1.00. The chart illustrates how the posterior mean converges towards 1.00 as the number of consecutive successes increases, and how the credible interval narrows.
### Components/Axes
* **X-axis:**
* Label: "n (number of consecutive successes)"
* Scale: Logarithmic (base 10)
* Markers: 10^0, 10^1, 10^2, 10^3, 10^4
* **Y-axis:**
* Label: "θ (posterior mean and credible interval)"
* Scale: Linear
* Markers: 0.86, 0.88, 0.90, 0.92, 0.94, 0.96, 0.98, 1.00
* **Legend (top-left):**
* "95% credible interval" (light blue shaded region)
* "Posterior mean" (dark blue line)
### Detailed Analysis
* **Posterior Mean (Dark Blue Line):**
* Trend: The posterior mean starts at approximately 0.85 at n = 10^0 and increases rapidly, approaching 1.00 as n increases.
* Data Points:
* n = 10^0 (1): θ ≈ 0.85
* n = 10^1 (10): θ ≈ 0.94
* n = 10^2 (100): θ ≈ 0.99
* n = 10^3 (1000): θ ≈ 0.998
* n = 10^4 (10000): θ ≈ 1.00
* **95% Credible Interval (Light Blue Shaded Region):**
* Trend: The credible interval is wide at low values of n and narrows as n increases, converging towards the posterior mean.
* Data Points:
* n = 10^0 (1): The interval spans from approximately 0.85 to 0.90.
* n = 10^1 (10): The interval spans from approximately 0.90 to 0.98.
* n = 10^2 (100): The interval spans from approximately 0.98 to 0.995.
* n = 10^3 (1000): The interval is very narrow, close to 1.00.
* n = 10^4 (10000): The interval is negligibly small, essentially at 1.00.
### Key Observations
* The posterior mean converges to 1.00 as the number of consecutive successes increases.
* The 95% credible interval narrows as the number of consecutive successes increases, indicating greater certainty in the estimate of θ.
* The most significant change in both the posterior mean and the credible interval occurs between n = 10^0 and n = 10^2.
### Interpretation
The chart demonstrates how Bayesian inference updates our belief about a parameter (θ) as we observe more data (consecutive successes). Initially, with little data (small n), there is considerable uncertainty, reflected in the wide credible interval. As the number of consecutive successes grows, our belief that θ is close to 1.00 strengthens, leading to a higher posterior mean and a narrower credible interval. This illustrates the principle that more data leads to more precise and confident estimates in Bayesian statistics. The rapid convergence suggests that even a relatively small number of consecutive successes can significantly improve our estimate of θ.