## Line Graph: Posterior Mean and 95% Credible Interval vs. Consecutive Successes
### Overview
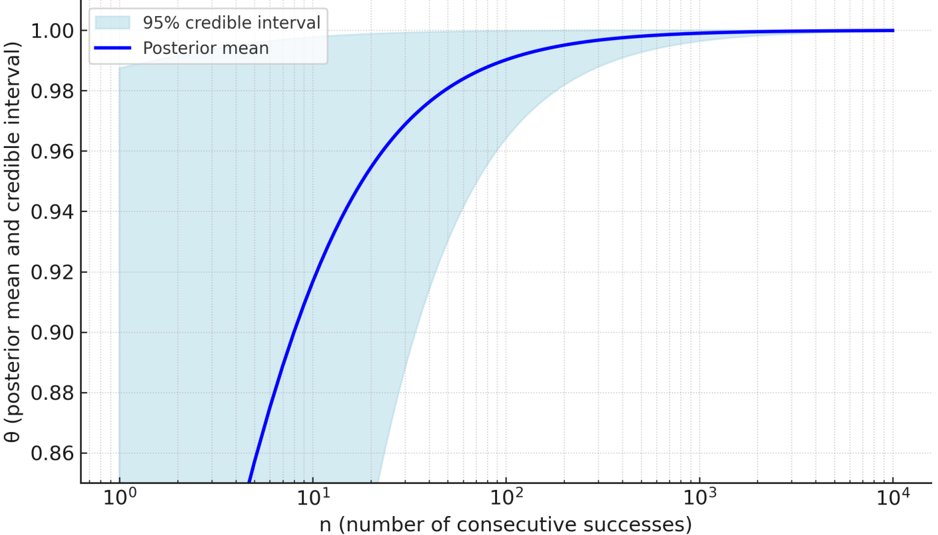
The graph depicts the relationship between the number of consecutive successes (`n`) and the posterior mean (blue line) and 95% credible interval (shaded blue region) for a parameter θ. The x-axis uses a logarithmic scale for `n`, while the y-axis represents θ values between 0.86 and 1.00.
### Components/Axes
- **X-axis**: `n` (number of consecutive successes), logarithmic scale from 10⁰ to 10⁴.
- **Y-axis**: θ (posterior mean and credible interval), linear scale from 0.86 to 1.00.
- **Legend**:
- **Blue line**: Posterior mean.
- **Light blue shaded area**: 95% credible interval.
- **Placement**: Legend is in the top-left corner. The graph occupies the central region of the image.
### Detailed Analysis
1. **Posterior Mean (Blue Line)**:
- At `n = 10⁰` (1 success), θ ≈ 0.86.
- Increases sharply for `n = 10¹` to `10²`, reaching ~0.98.
- Plateaus near θ ≈ 0.99 for `n ≥ 10³`.
- Final value at `n = 10⁴` remains ~0.99.
2. **95% Credible Interval (Shaded Area)**:
- At `n = 10⁰`, interval spans ~0.86 (lower bound) to ~0.98 (upper bound).
- Narrows significantly for `n = 10¹` to `10²`, converging to ~0.98–1.00.
- At `n = 10³` and `10⁴`, the interval is tightly bound around θ ≈ 0.99–1.00.
3. **Trends**:
- Posterior mean increases monotonically with `n`, approaching an asymptote near θ = 0.99.
- Credible interval width decreases logarithmically, reflecting reduced uncertainty with more data.
### Key Observations
- The posterior mean starts at 0.86 for a single success and asymptotically approaches 0.99 as `n` grows.
- The credible interval’s upper bound approaches 1.00, while the lower bound stabilizes near 0.98 for large `n`.
- The log-scale x-axis emphasizes the rapid initial increase in θ for small `n`, followed by diminishing returns.
### Interpretation
This graph illustrates Bayesian inference for a success probability θ given consecutive successes. The posterior mean and credible interval represent updated beliefs about θ as evidence accumulates. Key insights:
1. **Evidence Accumulation**: Early successes (small `n`) significantly raise θ estimates, but additional successes yield diminishing improvements.
2. **Uncertainty Reduction**: The narrowing credible interval demonstrates increased confidence in θ estimates with more data.
3. **Asymptotic Behavior**: The plateau near θ = 0.99 suggests a theoretical upper limit, possibly influenced by prior assumptions or model constraints (e.g., a Beta prior with high α/β values).
The graph underscores the trade-off between data collection and estimation precision in Bayesian frameworks, highlighting how early observations drive initial inferences while later data refines them.