## Chart Type: Step Plot
### Overview
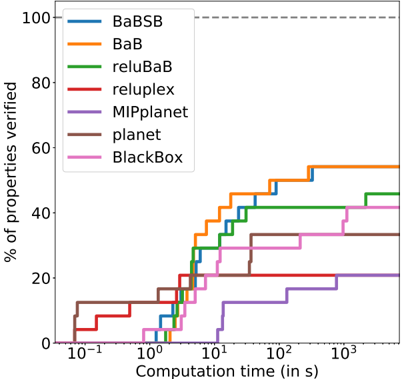
The image is a step plot comparing the performance of different verification methods. The x-axis represents computation time in seconds (logarithmic scale), and the y-axis represents the percentage of properties verified. Each line represents a different verification method.
### Components/Axes
* **X-axis:** Computation time (in s), logarithmic scale from 10<sup>-1</sup> to 10<sup>3</sup>.
* **Y-axis:** % of properties verified, linear scale from 0 to 100.
* **Legend (top-left):**
* Blue: BaBSB
* Orange: BaB
* Green: reluBaB
* Red: reluplex
* Purple: MIPplanet
* Brown: planet
* Pink: BlackBox
* A dashed grey line is present at the 100% mark.
### Detailed Analysis
Here's a breakdown of each method's performance:
* **BaBSB (Blue):** The line starts at 0% until approximately 1 second. It then increases to approximately 20% at 2 seconds, 40% at 5 seconds, 50% at 10 seconds, 55% at 20 seconds, 60% at 30 seconds, 70% at 50 seconds, 80% at 80 seconds, 90% at 100 seconds, and reaches 100% at approximately 200 seconds.
* **BaB (Orange):** The line starts at 0% until approximately 1 second. It then increases to approximately 10% at 2 seconds, 20% at 3 seconds, 30% at 5 seconds, 40% at 10 seconds, 45% at 20 seconds, 50% at 30 seconds, 55% at 50 seconds, and 60% at 100 seconds. It reaches 70% at 200 seconds, and 80% at 400 seconds.
* **reluBaB (Green):** The line starts at 0% until approximately 2 seconds. It then increases to approximately 20% at 3 seconds, 30% at 5 seconds, 40% at 10 seconds, 45% at 20 seconds, and 50% at 100 seconds.
* **reluplex (Red):** The line starts at 0% until approximately 0.1 seconds. It then increases to approximately 10% at 0.2 seconds, 12% at 1 second, 15% at 2 seconds, 20% at 5 seconds, and 22% at 10 seconds.
* **MIPplanet (Purple):** The line starts at 0% until approximately 1 second. It then increases to approximately 10% at 2 seconds, 20% at 5 seconds, 25% at 10 seconds, 30% at 50 seconds, and 35% at 100 seconds.
* **planet (Brown):** The line starts at 0% until approximately 0.1 seconds. It then increases to approximately 10% at 0.2 seconds, 12% at 1 second, 13% at 2 seconds, 14% at 5 seconds, 15% at 10 seconds, and 16% at 20 seconds.
* **BlackBox (Pink):** The line starts at 0% until approximately 1 second. It then increases to approximately 10% at 2 seconds, 20% at 5 seconds, 25% at 10 seconds, 30% at 50 seconds, and 32% at 100 seconds.
### Key Observations
* BaBSB reaches 100% verification within the observed time range, outperforming all other methods.
* BaB and reluBaB show similar performance, with BaB slightly better.
* reluplex, MIPplanet, planet, and BlackBox have significantly lower verification rates compared to BaBSB, BaB, and reluBaB.
* The step-like nature of the plot indicates discrete jumps in the percentage of properties verified as computation time increases.
### Interpretation
The plot compares the efficiency of different verification methods in terms of computation time required to verify a certain percentage of properties. BaBSB is the most efficient, achieving 100% verification in a relatively short time. The other methods plateau at lower verification rates within the observed time frame, suggesting they may be less effective or require significantly longer computation times to achieve higher verification rates. The step-like nature of the curves suggests that verification occurs in discrete stages, possibly corresponding to the completion of specific sub-tasks or the exploration of different branches in a decision tree.