## Heatmap: Pass@1 Performance Comparison of R1-Llama and R1-Qwen Models
### Overview
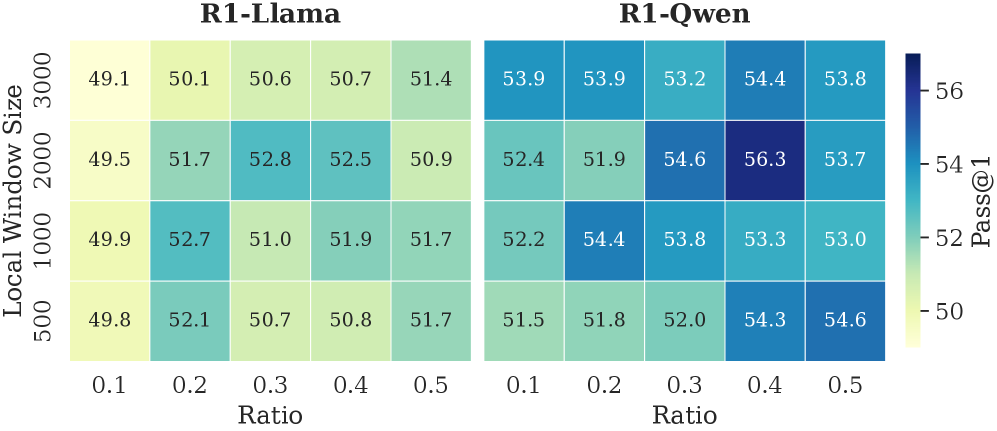
The image presents a comparative heatmap analysis of two language models (R1-Llama and R1-Qwen) across varying local window sizes (500, 1000, 2000, 3000) and ratio parameters (0.1, 0.2, 0.3, 0.4, 0.5). Pass@1 metrics are visualized using a color gradient from 50 (light yellow) to 56 (dark blue), with numerical values embedded in each cell.
### Components/Axes
- **X-axis (Horizontal)**: Ratio (0.1, 0.2, 0.3, 0.4, 0.5)
- **Y-axis (Vertical)**: Local Window Size (500, 1000, 2000, 3000)
- **Legend**: Vertical colorbar on the right, labeled "Pass@1" with values 50–56
- **Model Labels**:
- Left section: **R1-Llama**
- Right section: **R1-Qwen**
### Detailed Analysis
#### R1-Llama Section
| Window Size | Ratio 0.1 | Ratio 0.2 | Ratio 0.3 | Ratio 0.4 | Ratio 0.5 |
|-------------|-----------|-----------|-----------|-----------|-----------|
| 3000 | 49.1 | 50.1 | 50.6 | 50.7 | 51.4 |
| 2000 | 49.5 | 51.7 | 52.8 | 52.5 | 50.9 |
| 1000 | 49.9 | 52.7 | 51.0 | 51.9 | 51.7 |
| 500 | 49.8 | 52.1 | 50.7 | 50.8 | 51.7 |
#### R1-Qwen Section
| Window Size | Ratio 0.1 | Ratio 0.2 | Ratio 0.3 | Ratio 0.4 | Ratio 0.5 |
|-------------|-----------|-----------|-----------|-----------|-----------|
| 3000 | 53.9 | 53.9 | 53.2 | 54.4 | 53.8 |
| 2000 | 52.4 | 51.9 | 54.6 | 56.3 | 53.7 |
| 1000 | 52.2 | 54.4 | 53.8 | 53.3 | 53.0 |
| 500 | 51.5 | 51.8 | 52.0 | 54.3 | 54.6 |
### Key Observations
1. **R1-Qwen Dominance**: R1-Qwen consistently outperforms R1-Llama across all configurations, with a maximum Pass@1 of **56.3** (2000 window size, 0.4 ratio) vs. R1-Llama's peak of **52.8**.
2. **Ratio Sensitivity**: Both models show improved performance with higher ratios, though R1-Qwen's gains are more pronounced (e.g., 51.5 → 54.6 for 500 window size).
3. **Window Size Tradeoffs**:
- R1-Llama's performance peaks at smaller window sizes (500–1000) but declines at 2000/3000.
- R1-Qwen maintains strong performance across all window sizes, with 2000 window size showing optimal results.
4. **Anomalies**:
- R1-Llama's 3000 window size at 0.1 ratio (49.1) is the lowest value, suggesting a configuration mismatch.
- R1-Qwen's 2000 window size at 0.4 ratio (56.3) stands out as the global maximum.
### Interpretation
The data demonstrates that R1-Qwen exhibits superior scalability and efficiency compared to R1-Llama, particularly in high-ratio scenarios. The heatmap reveals that:
- **R1-Qwen's robustness**: Maintains high Pass@1 across all window sizes, indicating better generalization.
- **R1-Llama's limitations**: Struggles with larger window sizes, possibly due to computational constraints or architectural inefficiencies.
- **Optimal configuration**: For R1-Qwen, the 2000 window size and 0.4 ratio yields the best results, suggesting a balance between context length and parameter utilization.
The color gradient visually reinforces these trends, with darker blues correlating to higher Pass@1 values. The embedded numerical values confirm the heatmap's accuracy, while the spatial arrangement allows direct comparison between models. This analysis highlights R1-Qwen as the more versatile model for applications requiring adaptability across varying input sizes and ratios.