\n
## Line Chart: Acceptance Rate vs. HMC Step
### Overview
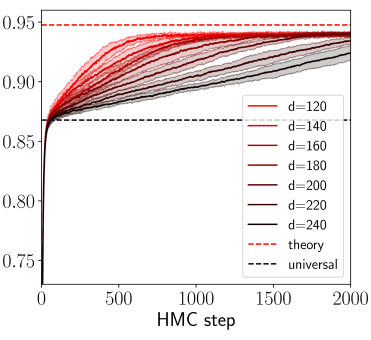
The image presents a line chart illustrating the acceptance rate of Hamiltonian Monte Carlo (HMC) steps as a function of the HMC step number. Multiple lines represent different values of a parameter 'd', alongside theoretical and universal acceptance rate benchmarks. The chart appears to demonstrate the convergence of acceptance rates with increasing HMC steps for various 'd' values.
### Components/Axes
* **X-axis:** "HMC step" ranging from 0 to 2000.
* **Y-axis:** Acceptance Rate, ranging from 0.75 to 0.95.
* **Legend:** Located in the top-right corner, listing the following lines:
* d = 120 (Red)
* d = 140 (Light Red)
* d = 160 (Medium Red)
* d = 180 (Dark Red)
* d = 200 (Brown)
* d = 220 (Gray)
* d = 240 (Dark Gray)
* theory (Red dashed line)
* universal (Black dashed line)
### Detailed Analysis
The chart displays several lines representing acceptance rates for different values of 'd'.
* **d = 120 (Red):** The line starts at approximately 0.87 at HMC step 0, rapidly increases to around 0.94 by HMC step 200, and plateaus around 0.94-0.95 for the remainder of the steps.
* **d = 140 (Light Red):** Starts at approximately 0.86 at HMC step 0, increases to around 0.93 by HMC step 200, and plateaus around 0.93-0.94.
* **d = 160 (Medium Red):** Starts at approximately 0.85 at HMC step 0, increases to around 0.92 by HMC step 200, and plateaus around 0.92-0.93.
* **d = 180 (Dark Red):** Starts at approximately 0.84 at HMC step 0, increases to around 0.91 by HMC step 200, and plateaus around 0.91-0.92.
* **d = 200 (Brown):** Starts at approximately 0.83 at HMC step 0, increases to around 0.90 by HMC step 200, and plateaus around 0.90-0.91.
* **d = 220 (Gray):** Starts at approximately 0.82 at HMC step 0, increases to around 0.89 by HMC step 200, and plateaus around 0.89-0.90.
* **d = 240 (Dark Gray):** Starts at approximately 0.81 at HMC step 0, increases to around 0.88 by HMC step 200, and plateaus around 0.88-0.89.
* **theory (Red dashed line):** A horizontal line at approximately 0.95 throughout the entire range of HMC steps.
* **universal (Black dashed line):** A horizontal line at approximately 0.86 throughout the entire range of HMC steps.
All lines for different 'd' values exhibit a similar trend: a rapid increase in acceptance rate during the initial HMC steps (0-200), followed by a plateau. The lines for smaller 'd' values (120, 140) tend to approach the 'theory' line, while larger 'd' values (220, 240) remain closer to the 'universal' line.
### Key Observations
* The acceptance rates for all 'd' values converge as the number of HMC steps increases.
* The acceptance rate is inversely proportional to the value of 'd'. Higher 'd' values result in lower acceptance rates.
* The 'theory' line represents an upper bound for the acceptance rate, while the 'universal' line represents a lower bound.
* The initial acceptance rates are all below both the 'theory' and 'universal' lines, indicating that the HMC process requires a certain number of steps to reach a stable acceptance rate.
### Interpretation
This chart demonstrates the behavior of acceptance rates in HMC sampling as a function of the number of steps and a parameter 'd'. The convergence of the lines suggests that, given enough steps, the HMC algorithm will reach a stable acceptance rate regardless of the value of 'd'. The inverse relationship between 'd' and acceptance rate implies that larger values of 'd' may require more steps to achieve the same level of convergence. The 'theory' and 'universal' lines likely represent theoretical limits or benchmarks for the acceptance rate, providing a context for evaluating the performance of the HMC algorithm. The 'universal' line could represent a lower bound for acceptance rate, perhaps related to the geometry of the target distribution. The fact that the lines approach these bounds suggests the algorithm is functioning as expected. The chart is useful for tuning the HMC algorithm and understanding the trade-offs between step size ('d') and convergence speed.