## Scatter Plot: Performance Comparison of Retrieval-Augmented Generation Models
### Overview
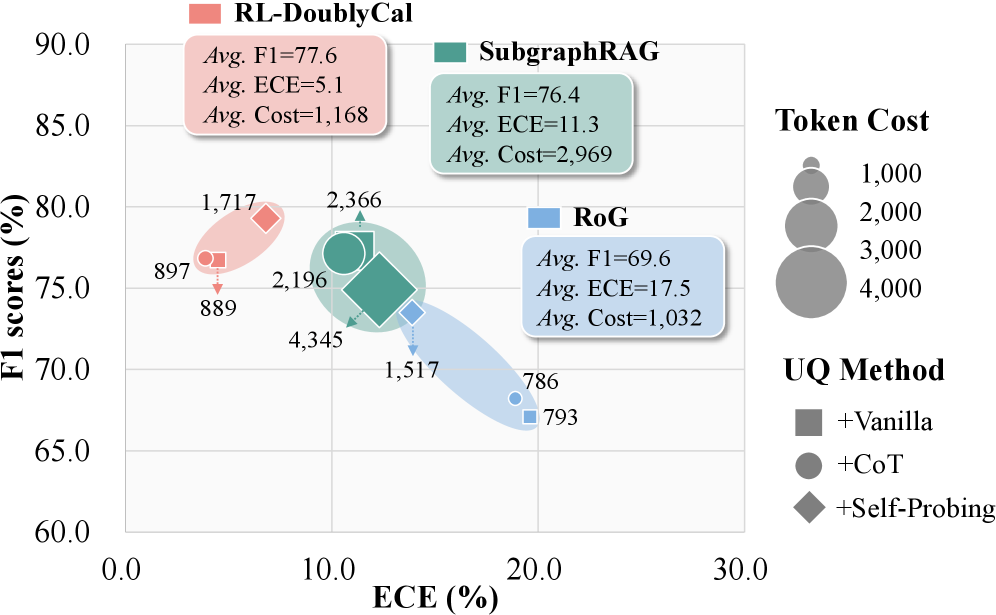
This scatter plot compares the performance of three Retrieval-Augmented Generation (RAG) models – RL-DoublyCal, SubgraphRAG, and RoG – based on their F1 scores, Expected Calibration Error (ECE), and token cost. The plot also indicates the Unique Questioning (UQ) method used with each model. The x-axis represents ECE (%), and the y-axis represents F1 scores (%). Token cost is represented by the size of the data point markers.
### Components/Axes
* **X-axis:** ECE (%) - Scale ranges from 0.0 to 30.0.
* **Y-axis:** F1 scores (%) - Scale ranges from 60.0 to 90.0.
* **Legend:** Located in the top-left corner, identifies the three RAG models:
* RL-DoublyCal (Red)
* SubgraphRAG (Gray)
* RoG (Blue)
* **UQ Method Legend:** Located in the bottom-right corner, identifies the Unique Questioning methods:
* +Vanilla (Red Square)
* +CoT (Green Circle)
* +Self-Probing (Red Diamond)
* **Token Cost Legend:** Located in the top-right corner, shows the mapping between marker size and token cost:
* 1,000 tokens (Smallest circle)
* 2,000 tokens (Medium circle)
* 3,000 tokens (Large circle)
* 4,000 tokens (Largest circle)
### Detailed Analysis
The plot contains several data points, each representing a specific configuration of a model and UQ method.
**RL-DoublyCal (Red):**
* Two data points are visible.
* Point 1: Approximately ECE = 8.5%, F1 = 75.5%, Token Cost ≈ 1,168 (Small marker). UQ Method: +Vanilla (Red Square). Label: 897
* Point 2: Approximately ECE = 9.5%, F1 = 76.5%, Token Cost ≈ 1,168 (Small marker). UQ Method: +Self-Probing (Red Diamond). Label: 889
* Point 3: Approximately ECE = 10.5%, F1 = 79.5%, Token Cost ≈ 1,168 (Small marker). UQ Method: +CoT (Green Circle). Label: 1,717
* Average F1 = 77.6
* Average ECE = 5.1
* Average Cost = 1,168
**SubgraphRAG (Gray):**
* Two data points are visible.
* Point 1: Approximately ECE = 11.5%, F1 = 77.5%, Token Cost ≈ 2,969 (Medium-Large marker). UQ Method: +Vanilla (Red Square). Label: 2,196
* Point 2: Approximately ECE = 24.5%, F1 = 72.5%, Token Cost ≈ 2,969 (Medium-Large marker). UQ Method: +CoT (Green Circle). Label: 2,366
* Average F1 = 76.4
* Average ECE = 11.3
* Average Cost = 2,969
**RoG (Blue):**
* Four data points are visible.
* Point 1: Approximately ECE = 19.5%, F1 = 70.5%, Token Cost ≈ 1,032 (Small marker). UQ Method: +Vanilla (Red Square). Label: 786
* Point 2: Approximately ECE = 20.5%, F1 = 69.5%, Token Cost ≈ 1,032 (Small marker). UQ Method: +CoT (Green Circle). Label: 793
* Point 3: Approximately ECE = 8.5%, F1 = 76.5%, Token Cost ≈ 1,032 (Small marker). UQ Method: +Self-Probing (Red Diamond). Label: 4,345
* Point 4: Approximately ECE = 11.5%, F1 = 72.5%, Token Cost ≈ 1,032 (Small marker). UQ Method: +Vanilla (Red Square). Label: 1,517
* Average F1 = 69.6
* Average ECE = 17.5
* Average Cost = 1,032
### Key Observations
* RL-DoublyCal generally exhibits the highest F1 scores, but with relatively low ECE values.
* SubgraphRAG has moderate F1 scores and higher ECE values, and the highest token costs.
* RoG consistently shows the lowest F1 scores and moderate ECE values.
* The +CoT UQ method appears to slightly decrease F1 scores for SubgraphRAG and RoG, while increasing ECE.
* Token cost varies significantly between models, with SubgraphRAG being the most expensive.
### Interpretation
The data suggests that RL-DoublyCal is the most performant model in terms of F1 score and calibration (low ECE), but it is not necessarily the most cost-effective. SubgraphRAG offers a trade-off between performance and cost, while RoG appears to be the least effective option. The choice of UQ method can influence performance, with +CoT potentially leading to decreased accuracy for some models. The relationship between ECE and F1 score is not strictly linear; higher F1 scores do not always correspond to lower ECE values. The size of the data points (token cost) is correlated with the model, suggesting that more complex models tend to be more expensive to run. The labels (889, 897, etc.) likely represent individual experiment runs or data samples. The positioning of the points indicates that there is a degree of variance in performance within each model and UQ method combination.