\n
## Scatter Plot with Bubble Encoding: Performance (F1) vs. Calibration (ECE) for Three Methods
### Overview
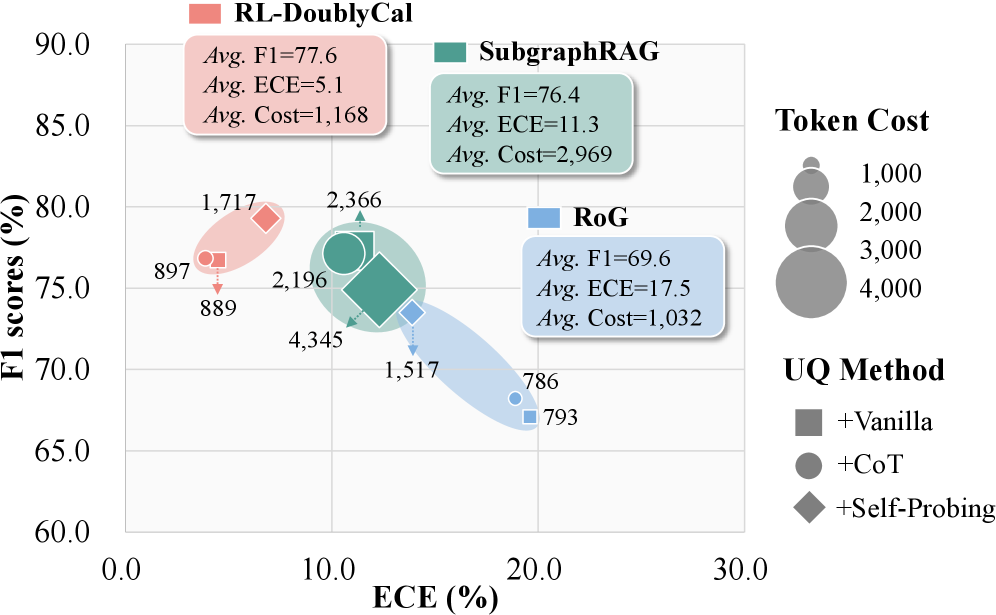
The image is a scatter plot comparing three different methods—RL-DoublyCal, SubgraphRAG, and RoG—on two primary metrics: F1 score (%) and Expected Calibration Error (ECE, %). A third metric, Token Cost, is encoded by the size of the data point bubbles. Each method is further broken down by the Uncertainty Quantification (UQ) method used, indicated by the shape of the marker. The plot includes summary statistics for each method in colored boxes.
### Components/Axes
* **X-Axis:** Labeled **"ECE (%)"**. Scale ranges from 0.0 to 30.0, with major ticks at 0.0, 10.0, 20.0, and 30.0.
* **Y-Axis:** Labeled **"F1 scores (%)"**. Scale ranges from 60.0 to 90.0, with major ticks at 60.0, 65.0, 70.0, 75.0, 80.0, 85.0, and 90.0.
* **Legend (Top Right):**
* **Token Cost:** Encoded by bubble size. A key shows four gray circles of increasing size labeled 1,000, 2,000, 3,000, and 4,000.
* **UQ Method:** Encoded by marker shape.
* Square: **+Vanilla**
* Circle: **+CoT**
* Diamond: **+Self-Probing**
* **Method Labels & Summary Boxes:**
* **RL-DoublyCal (Pink):** Box located top-left. Text: `Avg. F1=77.6`, `Avg. ECE=5.1`, `Avg. Cost=1,168`.
* **SubgraphRAG (Teal):** Box located top-center. Text: `Avg. F1=76.4`, `Avg. ECE=11.3`, `Avg. Cost=2,969`.
* **RoG (Blue):** Box located center-right. Text: `Avg. F1=69.6`, `Avg. ECE=17.5`, `Avg. Cost=1,032`.
### Detailed Analysis
**Data Series and Points:**
1. **RL-DoublyCal (Pink Cluster):**
* **Visual Trend:** Clustered in the top-left quadrant, indicating high F1 and low ECE.
* **Data Points:**
* **Pink Square (+Vanilla):** Positioned at approximately (ECE ~5.0, F1 ~77.0). Annotated with token cost **889**.
* **Pink Circle (+CoT):** Positioned at approximately (ECE ~4.5, F1 ~76.5). Annotated with token cost **897**.
* **Pink Diamond (+Self-Probing):** Positioned at approximately (ECE ~6.0, F1 ~80.0). Annotated with token cost **1,717**.
2. **SubgraphRAG (Teal Cluster):**
* **Visual Trend:** Clustered in the center, with moderate F1 and ECE values. Shows the widest spread in token cost.
* **Data Points:**
* **Teal Square (+Vanilla):** Positioned at approximately (ECE ~11.0, F1 ~75.0). Annotated with token cost **4,345**.
* **Teal Circle (+CoT):** Positioned at approximately (ECE ~10.0, F1 ~78.0). Annotated with token cost **2,196**.
* **Teal Diamond (+Self-Probing):** Positioned at approximately (ECE ~12.0, F1 ~80.0). Annotated with token cost **2,366**.
3. **RoG (Blue Cluster):**
* **Visual Trend:** Clustered in the bottom-right quadrant, indicating lower F1 and higher ECE.
* **Data Points:**
* **Blue Square (+Vanilla):** Positioned at approximately (ECE ~19.0, F1 ~68.0). Annotated with token cost **793**.
* **Blue Circle (+CoT):** Positioned at approximately (ECE ~18.5, F1 ~68.5). Annotated with token cost **786**.
* **Blue Diamond (+Self-Probing):** Positioned at approximately (ECE ~15.0, F1 ~71.0). Annotated with token cost **1,517**.
### Key Observations
1. **Performance-Cost Trade-off:** RL-DoublyCal achieves the best balance of high F1 and low ECE with a moderate average token cost (1,168). SubgraphRAG has comparable F1 but significantly higher ECE and the highest average cost (2,969). RoG has the lowest cost (1,032) but also the lowest performance and worst calibration.
2. **Impact of UQ Method:** For all three base methods, the **+Self-Probing** variant (diamond) consistently yields the highest F1 score within its cluster, but also tends to increase token cost compared to +Vanilla and +CoT.
3. **Calibration vs. Performance:** There is a clear negative correlation visible across the three method clusters: as ECE increases (moving right on the x-axis), F1 score decreases (moving down on the y-axis).
4. **Cost Variance:** SubgraphRAG shows the largest variance in token cost, ranging from 2,196 to 4,345. RL-DoublyCal and RoG have more tightly grouped costs.
### Interpretation
This chart evaluates the trade-offs between predictive performance (F1), model calibration (ECE), and computational cost (Token Cost) for three retrieval-augmented generation or reasoning methods.
* **RL-DoublyCal** appears to be the most robust method, offering a strong balance. Its low average ECE (5.1%) suggests its confidence scores are well-aligned with its actual accuracy, making its outputs more reliable. The use of **+Self-Probing** boosts its F1 to ~80% but nearly doubles the cost compared to its other variants.
* **SubgraphRAG** matches RL-DoublyCal in average F1 (76.4% vs 77.6%) but is poorly calibrated (Avg. ECE=11.3%). Its high token cost, especially for the **+Vanilla** variant (4,345), suggests a more complex or verbose reasoning process that does not translate to better calibration or superior performance.
* **RoG** is the most cost-efficient but underperforms on both primary metrics. Its high ECE (Avg. 17.5%) indicates overconfidence in its predictions. Similar to the others, **+Self-Probing** improves its F1 score but at a higher token cost.
The overarching insight is that achieving good calibration (low ECE) is a distinct challenge from achieving high accuracy (high F1). RL-DoublyCal seems to address both more effectively. Furthermore, advanced UQ methods like **+Self-Probing** consistently improve performance across different base systems but at an additional computational cost, presenting a clear cost-benefit decision for system designers.