## Scatter Plot: Method Performance Comparison
### Overview
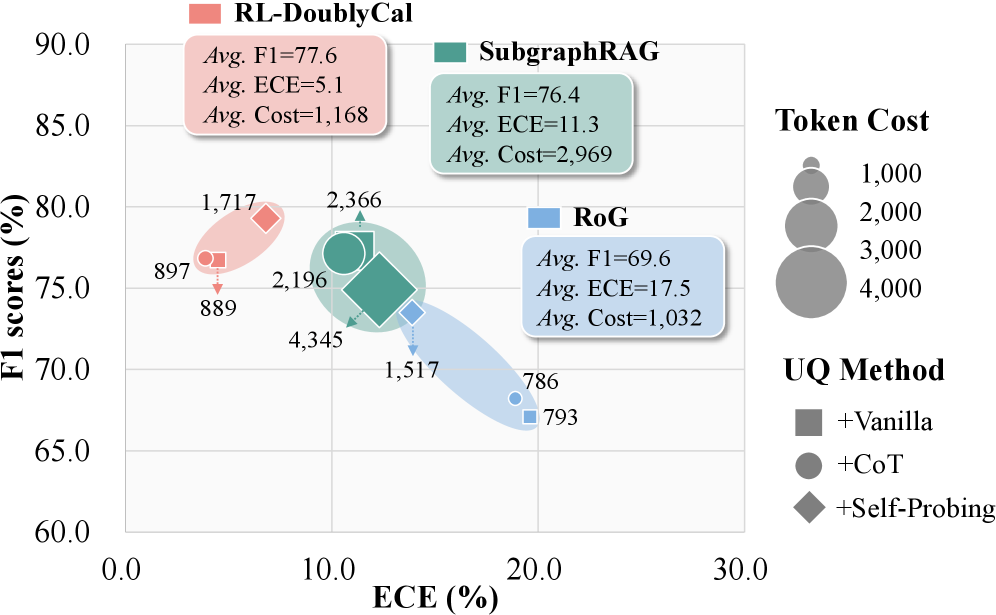
The image is a scatter plot comparing three methods (RL-DoublyCal, SubgraphRAG, RoG) across two metrics: F1 scores (%) and Expected Calibration Error (ECE, %). Each method is represented by a distinct color (red, green, blue) and includes average performance metrics (F1, ECE, token cost) in text boxes. Data points are annotated with numerical values, likely representing sample counts or instances. Token cost is visualized via circle size, with a legend indicating ranges (1,000–4,000).
---
### Components/Axes
- **Y-Axis**: F1 scores (%) ranging from 60.0 to 90.0 in 5% increments.
- **X-Axis**: ECE (%) ranging from 0.0 to 30.0 in 10% increments.
- **Legend**:
- **Methods**:
- Red: RL-DoublyCal
- Green: SubgraphRAG
- Blue: RoG
- **UQ Methods**:
- Square: +Vanilla
- Circle: +CoT
- Diamond: +Self-Probing
- **Token Cost**: Circle size correlates with cost (1,000–4,000).
---
### Detailed Analysis
#### RL-DoublyCal (Red)
- **Average Metrics**: F1=77.6, ECE=5.1, Cost=1,168.
- **Data Points**:
- (ECE=5%, F1=89.7%, count=1,717)
- (ECE=10%, F1=75%, count=2,196)
- (ECE=15%, F1=70%, count=4,345)
- **Trend**: Higher F1 scores at lower ECE, with increasing token cost as ECE rises.
#### SubgraphRAG (Green)
- **Average Metrics**: F1=76.4, ECE=11.3, Cost=2,969.
- **Data Points**:
- (ECE=10%, F1=80%, count=2,366)
- (ECE=20%, F1=70%, count=1,517)
- **Trend**: Moderate F1 scores with higher ECE and significantly larger token costs.
#### RoG (Blue)
- **Average Metrics**: F1=69.6, ECE=17.5, Cost=1,032.
- **Data Points**:
- (ECE=5%, F1=70%, count=1,517)
- (ECE=20%, F1=65%, count=786)
- **Trend**: Lower F1 scores and higher ECE, but smaller token costs compared to SubgraphRAG.
---
### Key Observations
1. **RL-DoublyCal** achieves the highest F1 scores (up to 89.7%) with the lowest ECE (5.1%) and moderate token costs.
2. **SubgraphRAG** has the highest token cost (2,969) and ECE (11.3%), suggesting inefficiency despite competitive F1 scores.
3. **RoG** underperforms in F1 (69.6%) and ECE (17.5%) but has the lowest token cost (1,032).
4. **Token Cost Correlation**: Larger circles (higher cost) align with SubgraphRAG, while smaller circles (lower cost) align with RoG.
5. **Outliers**: RL-DoublyCal’s point at ECE=15% (F1=70%) shows a drop in performance compared to its ECE=5% peak.
---
### Interpretation
- **Performance Trade-offs**: RL-DoublyCal balances high accuracy (F1) and calibration (low ECE) with reasonable cost, making it the most efficient method. SubgraphRAG’s high cost and ECE suggest diminishing returns, while RoG’s low cost comes at the expense of performance.
- **UQ Method Impact**: The UQ method (Vanilla, CoT, Self-Probing) likely influences results, but the image does not explicitly map UQ methods to data points. Further analysis would clarify their effects.
- **Efficiency Insight**: Token cost does not strictly correlate with performance. RL-DoublyCal achieves high F1 with moderate cost, whereas SubgraphRAG’s high cost does not translate to superior metrics.
This analysis highlights RL-DoublyCal as the optimal choice for balancing accuracy, calibration, and cost, while SubgraphRAG and RoG represent trade-offs between these factors.