## Heatmap: Layer-wise Parameter Importance in a Neural Network
### Overview
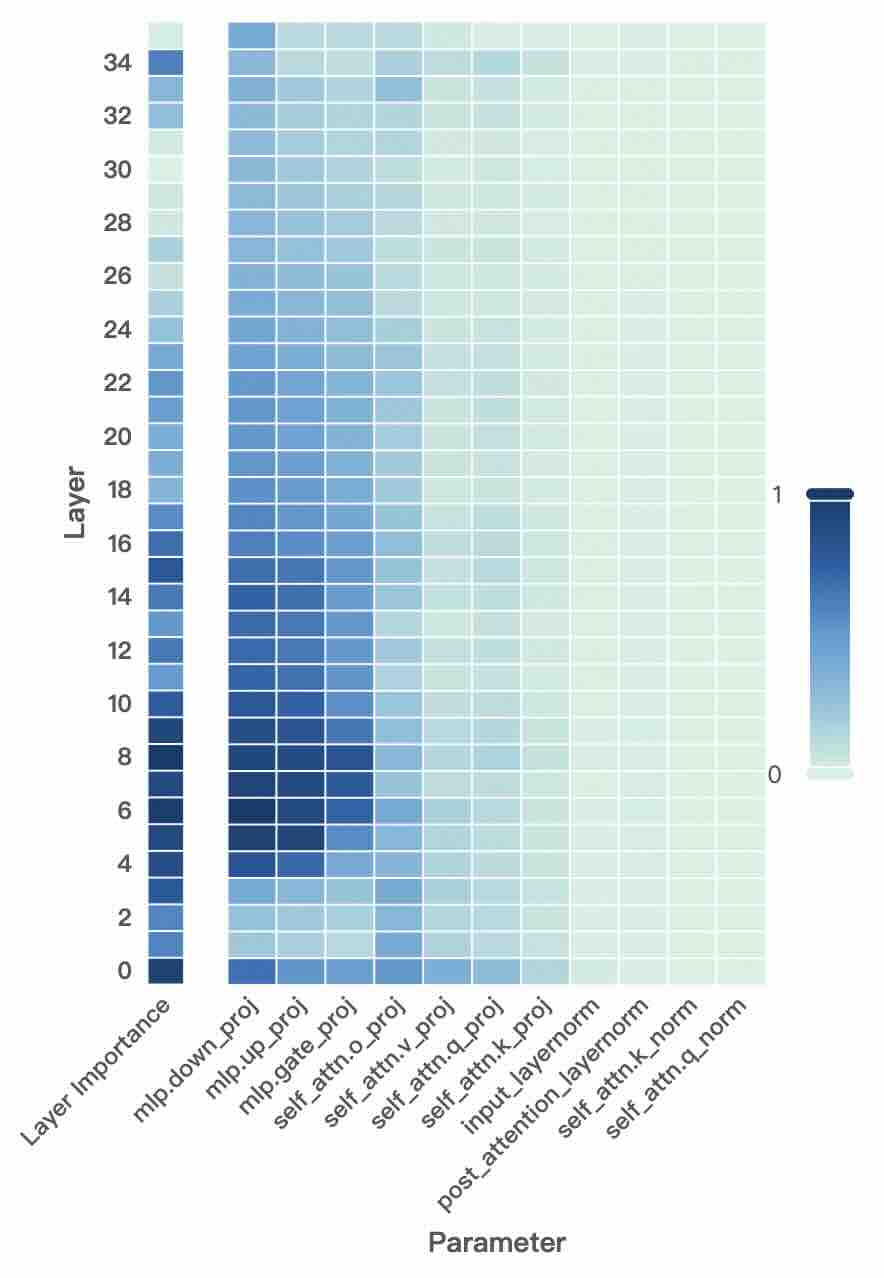
The image is a heatmap visualizing the relative importance of different parameters across the layers of a neural network model. The heatmap uses a color gradient to represent importance values, with darker blue indicating higher importance (closer to 1) and lighter green/white indicating lower importance (closer to 0). The data suggests an analysis of which components within a model's architecture are most significant at different depths.
### Components/Axes
* **Vertical Axis (Y-axis):** Labeled **"Layer"**. It lists numerical layer indices from **0** at the bottom to **34** at the top, incrementing by 2 (0, 2, 4, ..., 34). This represents the depth of the neural network.
* **Horizontal Axis (X-axis):** Labeled **"Parameter"**. It lists 12 specific parameter types, which are components of a transformer-based model architecture. From left to right:
1. `Layer Importance`
2. `mlp.down_proj`
3. `mlp.up_proj`
4. `mlp.gate_proj`
5. `self_attn.o_proj`
6. `self_attn.v_proj`
7. `self_attn.q_proj`
8. `self_attn.k_proj`
9. `input_layernorm`
10. `post_attention_layernorm`
11. `self_attn.k_norm`
12. `self_attn.q_norm`
* **Color Scale/Legend:** Positioned on the **right side** of the chart. It is a vertical bar showing a gradient from a very light green/white at the bottom (labeled **"0"**) to a dark blue at the top (labeled **"1"**). This defines the mapping of color to importance value.
### Detailed Analysis
The heatmap is a grid where each cell's color corresponds to the importance of a specific parameter at a specific layer.
**Trend Verification & Data Point Extraction:**
* **`Layer Importance` (First Column):** This column is consistently the darkest blue across **all layers (0-34)**, indicating a very high importance value (≈1.0) throughout the network. This likely represents an aggregate or baseline metric.
* **MLP Projection Layers (`mlp.down_proj`, `mlp.up_proj`, `mlp.gate_proj`):** These three columns show a distinct pattern. They are **darkest blue (high importance, ≈0.8-1.0) in the lower-to-mid layers (approximately layers 4-16)**. The importance gradually fades to a medium blue (≈0.4-0.6) in the higher layers (18-34). `mlp.down_proj` and `mlp.up_proj` appear slightly more important than `mlp.gate_proj` in the mid-layers.
* **Self-Attention Output & Value Projections (`self_attn.o_proj`, `self_attn.v_proj`):** These columns are a **medium blue (≈0.3-0.5)** in the lower layers (0-10), becoming lighter (≈0.1-0.3) in the mid and upper layers.
* **Self-Attention Query & Key Projections (`self_attn.q_proj`, `self_attn.k_proj`):** These are **light blue to very light green (≈0.1-0.3)** across most layers, with slightly higher values in the very early layers (0-6).
* **Layer Normalization Terms (`input_layernorm`, `post_attention_layernorm`, `self_attn.k_norm`, `self_attn.q_norm`):** These four rightmost columns are the **lightest in color (very light green/white, ≈0.0-0.15)** across the entire layer range, indicating consistently low measured importance in this analysis.
### Key Observations
1. **Dominance of MLP Layers:** The Multi-Layer Perceptron (MLP) projection layers (`down_proj`, `up_proj`, `gate_proj`) are the most important parameters after the aggregate `Layer Importance`, especially in the first half of the network.
2. **Layer-Dependent Importance:** Importance is not uniform. MLP parameters are critical in early/mid layers, while attention projections (`o_proj`, `v_proj`) have moderate importance early on that diminishes. Query/Key projections and normalization layers have low importance throughout.
3. **Clear Gradient:** There is a smooth visual gradient from left to right (high to low importance) and a vertical gradient within the MLP columns (high in early layers, decreasing later).
4. **Anomaly/Notable Point:** The `Layer Importance` column is uniformly maximal. This suggests it may be a different type of metric (e.g., a normalized sum or a separate importance score for the layer as a whole) rather than a parameter weight importance like the others.
### Interpretation
This heatmap provides a diagnostic view of a trained neural network's internal mechanics, likely from an interpretability or pruning study.
* **What the data suggests:** The analysis indicates that the **MLP blocks, particularly their down-projection and up-projection matrices, are the primary carriers of important information or computation in the earlier to middle stages of this model**. This aligns with some research suggesting MLP layers act as key "knowledge storage" components.
* **Relationship between elements:** The flow of importance seems to move from the MLP layers in the early network towards the attention output projections (`o_proj`), with the raw query/key projections and normalization layers being less critical for the specific importance metric used here. The uniform high value of `Layer Importance` implies that while individual parameter importance varies, the layers themselves are all considered significant contributors.
* **Potential implications:** If the goal were model compression or pruning, this chart suggests that the MLP projection layers in the first half of the network are the most sensitive to modification. Conversely, the normalization layers and query/key projections might be more candidates for aggressive pruning with less impact on performance. The diminishing importance of MLPs in later layers might indicate a shift in the type of processing performed deeper in the network.