## Diagram: Hierarchical Feedback System with Lambda Nodes
### Overview
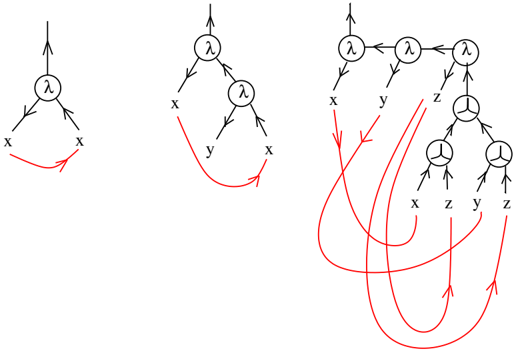
The image depicts three interconnected diagrams illustrating a hierarchical system with lambda (λ) nodes, variables (x, y, z), and feedback loops. The diagrams progress from simple to complex structures, emphasizing directional relationships and recursive feedback mechanisms.
### Components/Axes
- **Nodes**:
- Lambda (λ): Central decision/processing nodes (represented as circles).
- Variables (x, y, z): Terminal nodes (represented as squares).
- **Arrows**:
- Black arrows: Primary directional flow (top-down hierarchy).
- Red arrows: Feedback loops (recursive connections from variables back to λ nodes).
- **Structure**:
- Diagrams are arranged left-to-right in increasing complexity.
- No explicit axes or scales; relationships are qualitative.
### Detailed Analysis
1. **Left Diagram**:
- Single λ node connected to two x nodes via black arrows.
- Red feedback loop connects x nodes back to λ, forming a closed loop.
- Textual labels: "λ", "x" (repeated).
2. **Middle Diagram**:
- Two λ nodes in series, with the first λ connected to x and the second to y.
- Red feedback loop connects y back to the first λ node.
- Textual labels: "λ" (repeated), "x", "y".
3. **Right Diagram**:
- Complex hierarchy with three λ nodes in series.
- First λ connects to x, second to y, third to z.
- Multiple red feedback loops:
- x → first λ
- z → second λ
- y → third λ
- z → third λ
- Textual labels: "λ" (repeated), "x", "y", "z".
### Key Observations
- **Feedback Proliferation**: The rightmost diagram shows the most feedback loops (4), suggesting increased system interdependence.
- **Variable Recursion**: Variables (x, y, z) feed back into earlier λ nodes, implying iterative processing.
- **Hierarchical Depth**: Complexity increases from 1 λ node (left) to 3 λ nodes (right), with feedback complexity scaling accordingly.
### Interpretation
This diagram represents a **recursive decision-making system** where:
1. **Lambda nodes** act as processing units that propagate decisions downward (to x, y, z).
2. **Feedback loops** enable variables to influence earlier stages, creating potential for:
- Iterative refinement (e.g., x → λ → x → λ...)
- Systemic coupling between variables and decisions.
3. The progression from left to right diagrams may symbolize:
- **Simplification to complexity**: Basic feedback (left) → Moderate coupling (middle) → Highly interconnected system (right).
- **Temporal evolution**: A system becoming more recursive over time.
The red feedback arrows are critical—they transform a static hierarchy into a dynamic, self-referential system. This could model processes like:
- Machine learning feedback cycles
- Organizational decision-making with bottom-up input
- Computational graphs with gradient backpropagation
No numerical data is present; the diagram focuses on structural relationships rather than quantitative metrics.