## Multi-Panel Chart: Sound Environment Analysis
### Overview
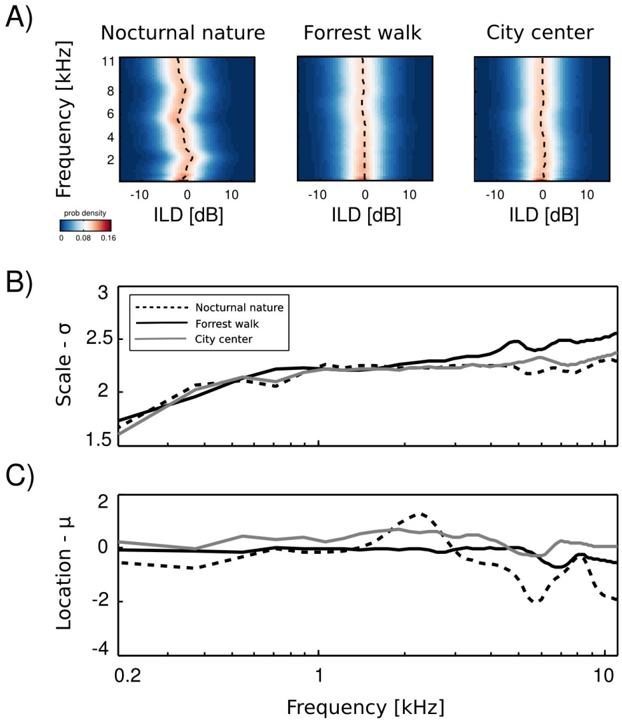
The image presents a multi-panel chart comparing sound characteristics across three environments: "Nocturnal nature," "Forrest walk," and "City center." Panel A displays probability density heatmaps of Interaural Level Difference (ILD) versus Frequency. Panel B shows the "Scale - σ" parameter as a function of frequency for each environment, and Panel C shows the "Location - μ" parameter as a function of frequency for each environment.
### Components/Axes
**Panel A: Heatmaps**
* **Title:** Nocturnal nature, Forrest walk, City center (displayed above each respective heatmap)
* **Y-axis:** Frequency [kHz], ranging from 0 to 11.
* **X-axis:** ILD [dB], ranging from -10 to 10.
* **Colorbar:** "prob density" ranging from 0 (blue) to 0.16 (red).
* A dashed black line is overlaid on each heatmap, representing a central tendency.
**Panel B: Scale (σ) vs. Frequency**
* **Y-axis:** Scale - σ, ranging from 1.5 to 3.
* **X-axis:** Frequency [kHz], ranging from 0.2 to 10 (logarithmic scale).
* **Legend (top-left):**
* Dashed Black Line: Nocturnal nature
* Solid Black Line: Forrest walk
* Solid Gray Line: City center
**Panel C: Location (μ) vs. Frequency**
* **Y-axis:** Location - μ, ranging from -4 to 2.
* **X-axis:** Frequency [kHz], ranging from 0.2 to 10 (logarithmic scale).
* **Legend:** (Same as Panel B)
* Dashed Black Line: Nocturnal nature
* Solid Black Line: Forrest walk
* Solid Gray Line: City center
### Detailed Analysis
**Panel A: Heatmaps**
* **Nocturnal nature:** The heatmap shows a concentration of probability density around ILD = 0 dB across all frequencies. The dashed black line fluctuates slightly around 0 dB, indicating a small variation in the average ILD across frequencies.
* **Forrest walk:** Similar to "Nocturnal nature," the probability density is concentrated around ILD = 0 dB. The dashed black line remains close to 0 dB.
* **City center:** The probability density is also concentrated around ILD = 0 dB. The dashed black line is close to 0 dB.
**Panel B: Scale (σ) vs. Frequency**
* **Nocturnal nature (Dashed Black):** Starts at approximately 1.6 at 0.2 kHz, increases to approximately 2.2 at 1 kHz, and then fluctuates around 2.2-2.4 until 10 kHz.
* **Forrest walk (Solid Black):** Starts at approximately 1.6 at 0.2 kHz, increases to approximately 2.2 at 1 kHz, then increases to approximately 2.6 at 4 kHz, and then decreases slightly to approximately 2.4 at 10 kHz.
* **City center (Solid Gray):** Starts at approximately 1.7 at 0.2 kHz, increases to approximately 2.2 at 1 kHz, and remains relatively stable around 2.2 until 10 kHz.
**Panel C: Location (μ) vs. Frequency**
* **Nocturnal nature (Dashed Black):** Starts at approximately -0.5 at 0.2 kHz, increases to approximately 0 at 1 kHz, then decreases to approximately -2 at 4 kHz, and then increases to approximately -0.5 at 10 kHz.
* **Forrest walk (Solid Black):** Starts at approximately -0.5 at 0.2 kHz, increases to approximately 0 at 1 kHz, and remains relatively stable around 0 until 10 kHz.
* **City center (Solid Gray):** Starts at approximately 0 at 0.2 kHz, increases to approximately 1 at 1 kHz, and remains relatively stable around 1 until 10 kHz.
### Key Observations
* **ILD Distribution:** All three environments show a concentration of sound around ILD = 0 dB, suggesting a balanced sound field from left to right.
* **Scale (σ):** "Forrest walk" exhibits a higher scale (σ) value at higher frequencies compared to "Nocturnal nature" and "City center," indicating greater variability in the sound levels.
* **Location (μ):** "City center" has a consistently higher location (μ) value compared to the other two environments, suggesting a shift in the average sound level. "Nocturnal nature" has a negative location (μ) value at higher frequencies.
### Interpretation
The data suggests that while all three environments have a balanced sound field (ILD ≈ 0 dB), they differ in the variability (scale σ) and average level (location μ) of sound across different frequencies. The "Forrest walk" environment has higher variability at higher frequencies, possibly due to rustling leaves or animal sounds. The "City center" environment has a higher average sound level, likely due to traffic and other urban noises. The "Nocturnal nature" environment has a lower average sound level at higher frequencies, which could be due to the absence of high-frequency sounds typically found in urban environments.