## Horizontal Bar Chart: Distribution of Harmfulness Categories
### Overview
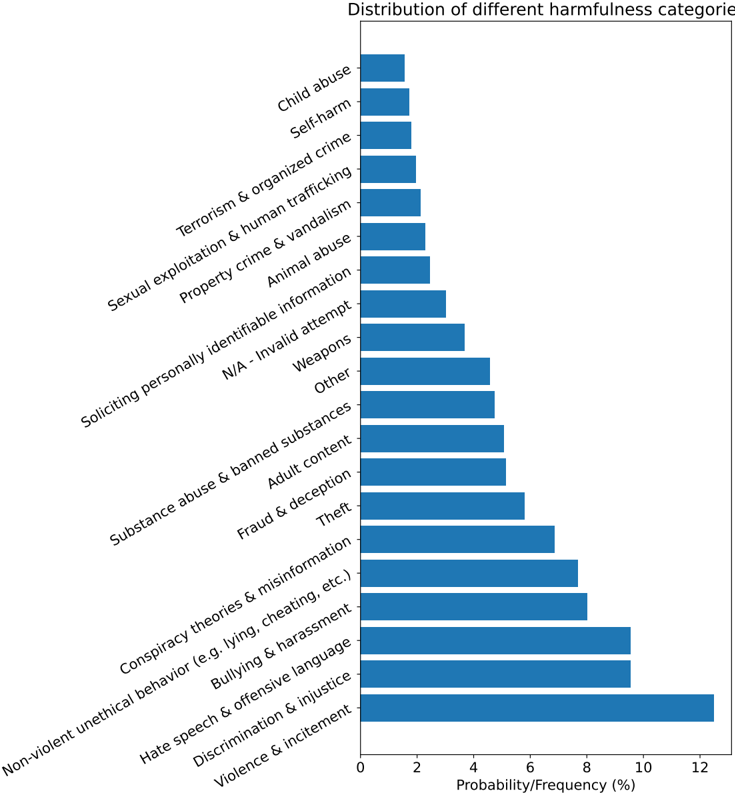
The image is a horizontal bar chart illustrating the distribution of different harmfulness categories. The chart displays the probability/frequency (in percentage) of each category, with the categories listed on the vertical axis and the corresponding percentages represented by the length of the horizontal bars. The bars are all the same color, a shade of blue.
### Components/Axes
* **Title:** Distribution of different harmfulness categories
* **Horizontal Axis:** Probability/Frequency (%)
* Scale: 0% to 12%, with tick marks at every 2% increment.
* **Vertical Axis:** Harmfulness Categories (listed from top to bottom)
* Child abuse
* Self-harm
* Terrorism & organized crime
* Sexual exploitation & human trafficking
* Property crime & vandalism
* Animal abuse
* Soliciting personally identifiable information
* N/A - Invalid attempt
* Weapons
* Other
* Substance abuse & banned substances
* Adult content
* Fraud & deception
* Theft
* Conspiracy theories & misinformation
* Non-violent unethical behavior (e.g. lying, cheating, etc.)
* Bullying & harassment
* Hate speech & offensive language
* Discrimination & injustice
* Violence & incitement
### Detailed Analysis
Here's a breakdown of the approximate probability/frequency for each category, as indicated by the length of the bars:
* **Violence & incitement:** ~12.5%
* **Discrimination & injustice:** ~10.5%
* **Hate speech & offensive language:** ~10%
* **Bullying & harassment:** ~9.5%
* **Non-violent unethical behavior (e.g. lying, cheating, etc.):** ~8%
* **Conspiracy theories & misinformation:** ~7.5%
* **Theft:** ~6%
* **Fraud & deception:** ~5.5%
* **Adult content:** ~5%
* **Substance abuse & banned substances:** ~4.5%
* **Other:** ~4%
* **Weapons:** ~3.5%
* **N/A - Invalid attempt:** ~3%
* **Soliciting personally identifiable information:** ~2.5%
* **Animal abuse:** ~2%
* **Property crime & vandalism:** ~1.75%
* **Sexual exploitation & human trafficking:** ~1.5%
* **Terrorism & organized crime:** ~1.25%
* **Self-harm:** ~1%
* **Child abuse:** ~0.75%
### Key Observations
* **Most Frequent Categories:** "Violence & incitement," "Discrimination & injustice," and "Hate speech & offensive language" have the highest probability/frequency.
* **Least Frequent Categories:** "Child abuse," "Self-harm," and "Terrorism & organized crime" have the lowest probability/frequency.
* **General Trend:** The probability/frequency decreases as you move up the chart from "Violence & incitement" to "Child abuse."
### Interpretation
The chart provides a relative comparison of the prevalence of different harmfulness categories. The data suggests that "Violence & incitement," "Discrimination & injustice," and "Hate speech & offensive language" are the most common types of harmful content encountered, while "Child abuse," "Self-harm," and "Terrorism & organized crime" are less frequent. This information could be used to prioritize content moderation efforts, develop targeted interventions, or inform public awareness campaigns. The "N/A - Invalid attempt" category suggests that some attempts to identify harmful content are unsuccessful or misclassified. The long tail of less frequent categories indicates the diversity of harmful content that needs to be addressed.