\n
## Bar Chart: Distribution of Harmfulness Categories
### Overview
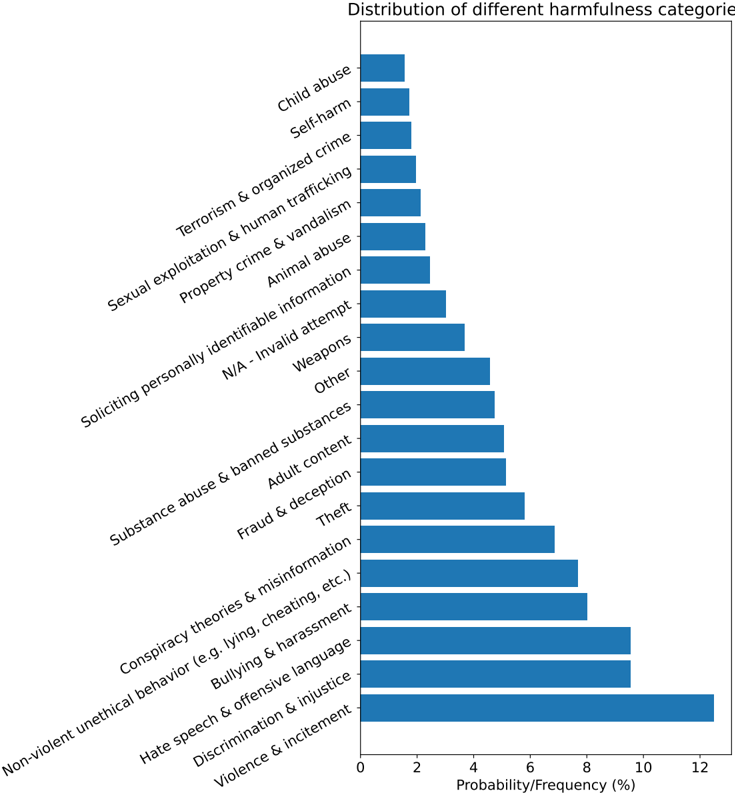
This is a horizontal bar chart displaying the distribution of different harmfulness categories, measured as Probability/Frequency (%). The categories are listed on the y-axis, and the corresponding probabilities/frequencies are represented by the length of the bars on the x-axis. The chart appears to rank categories by their prevalence.
### Components/Axes
* **Title:** "Distribution of different harmfulness categories" (top-center)
* **X-axis Label:** "Probability/Frequency (%)" (bottom-center)
* Scale: 0 to 12, with increments of 2.
* **Y-axis:** Lists the harmfulness categories (left side).
* **Bars:** Represent the probability/frequency of each category.
### Detailed Analysis
The categories and their approximate probabilities/frequencies (estimated from the bar lengths) are as follows:
1. **Child abuse:** Approximately 11.5%
2. **Self-harm:** Approximately 10.5%
3. **Terrorism & organized crime:** Approximately 9.5%
4. **Sexual exploitation & human trafficking:** Approximately 8.5%
5. **Property crime & vandalism:** Approximately 8%
6. **Animal abuse:** Approximately 7.5%
7. **Soliciting personally identifiable information:** Approximately 7%
8. **N/A - Invalid attempt:** Approximately 6.5%
9. **Weapons:** Approximately 6%
10. **Other:** Approximately 6%
11. **Substance abuse & banned substances:** Approximately 5.5%
12. **Adult content:** Approximately 5%
13. **Fraud & deception:** Approximately 4.5%
14. **Theft:** Approximately 4%
15. **Conspiracy theories & misinformation:** Approximately 3.5%
16. **Bullying & harassment:** Approximately 3%
17. **Hate speech & offensive language:** Approximately 2.5%
18. **Discrimination & injustice:** Approximately 2%
19. **Violence & incitement:** Approximately 1.5%
20. **Non-violent unethical behavior (e.g. lying, cheating, etc.):** Approximately 1%
The bars generally decrease in length as you move down the y-axis, indicating a decreasing probability/frequency of occurrence.
### Key Observations
* **Child abuse** and **Self-harm** have the highest probabilities/frequencies, significantly exceeding other categories.
* **Violence & incitement** and **Non-violent unethical behavior** have the lowest probabilities/frequencies.
* There is a relatively steep drop-off in frequency between the top few categories and the rest.
* "Weapons" and "Other" have similar probabilities/frequencies.
### Interpretation
The chart demonstrates a clear ranking of harmfulness categories based on their observed frequency. The prominence of "Child abuse" and "Self-harm" suggests these are the most prevalent issues being addressed or detected. The lower frequencies of categories like "Violence & incitement" and "Non-violent unethical behavior" could indicate effective preventative measures, lower reporting rates, or inherent rarity.
The grouping of "Weapons" and "Other" suggests that these categories are relatively similar in their occurrence. The "Other" category is a catch-all, and its frequency could indicate a need for more granular categorization.
The chart provides valuable insights into the distribution of harmful content or behaviors, which can inform resource allocation, policy development, and intervention strategies. The data suggests a focus on addressing "Child abuse" and "Self-harm" should be prioritized, while continued monitoring of other categories is also important.