## Bar Chart: Distribution of different harmfulness categories
### Overview
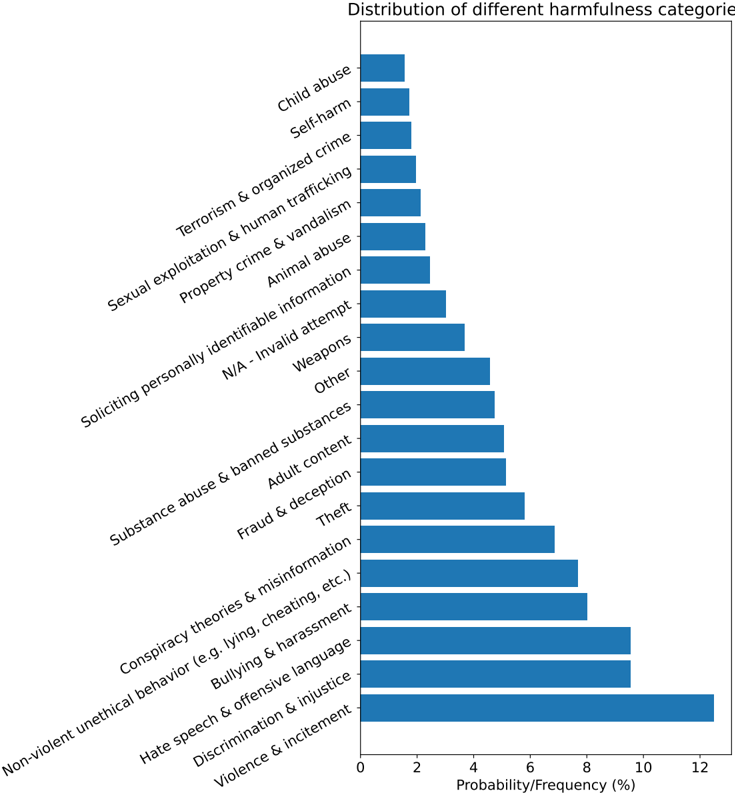
The chart displays a horizontal bar visualization of harmfulness categories ranked by their probability/frequency percentages. Categories are ordered from lowest (top) to highest (bottom) frequency, with bar lengths proportional to their occurrence rates.
### Components/Axes
- **Y-axis**: Harmfulness categories (text labels, top-to-bottom order)
- **X-axis**: Probability/Frequency (%) scale (0-12%)
- **Legend**: Right-aligned, single blue color key for all bars
- **Bars**: Horizontal blue bars with no numerical annotations
### Detailed Analysis
1. **Violence & incitement**: Longest bar at ~12% (bottom)
2. **Hate speech & offensive language**: ~10% (second from bottom)
3. **Discrimination & incitement**: ~10% (third from bottom)
4. **Bullying & harassment**: ~9% (fourth from bottom)
5. **Conspiracy theories & misinformation**: ~8% (fifth from bottom)
6. **Non-violent unethical behavior**: ~7% (sixth from bottom)
7. **Fraud & deception**: ~6% (seventh from bottom)
8. **Theft**: ~6% (eighth from bottom)
9. **Adult content**: ~5% (ninth from bottom)
10. **Substance abuse & banned substances**: ~5% (tenth from bottom)
11. **Soliciting personally identifiable information**: ~4% (eleventh from bottom)
12. **N/A - Invalid attempt**: ~3% (twelfth from bottom)
13. **Weapons**: ~3% (thirteenth from bottom)
14. **Other**: ~4% (fourteenth from bottom)
15. **Animal abuse**: ~2% (fifteenth from bottom)
16. **Property crime & vandalism**: ~2% (sixteenth from bottom)
17. **Sexual exploitation & human trafficking**: ~2% (seventeenth from bottom)
18. **Terrorism & organized crime**: ~2% (eighteenth from bottom)
19. **Self-harm**: ~1% (nineteenth from bottom)
20. **Child abuse**: ~1% (topmost category)
### Key Observations
- **Dominant categories**: Violence-related offenses (12%) and hate speech (10%) dominate the distribution
- **Low-frequency outliers**: Child abuse (1%) and self-harm (1%) show minimal occurrence
- **Mid-range clustering**: 6-8% range contains 4 categories (fraud, theft, substance abuse, adult content)
- **Ambiguous grouping**: "Other" category (4%) appears mid-distribution despite being a catch-all
### Interpretation
The data suggests a significant concentration of harmful content in violence-related and hate speech categories, with these two groups accounting for 22% of total occurrences. The presence of "N/A - Invalid attempt" (3%) and "Other" (4%) indicates potential data quality issues or unclassified content. The stark contrast between high-frequency violence categories and low-frequency personal harm categories (child abuse, self-harm) may reflect either content moderation effectiveness or differing user behavior patterns. The mid-range categories (6-8%) suggest moderate prevalence of deception and misinformation tactics. The chart's lack of numerical annotations introduces uncertainty in precise values, though the relative ordering appears consistent.