\n
## Bar Chart: E-CARE Avg. Coherence
### Overview
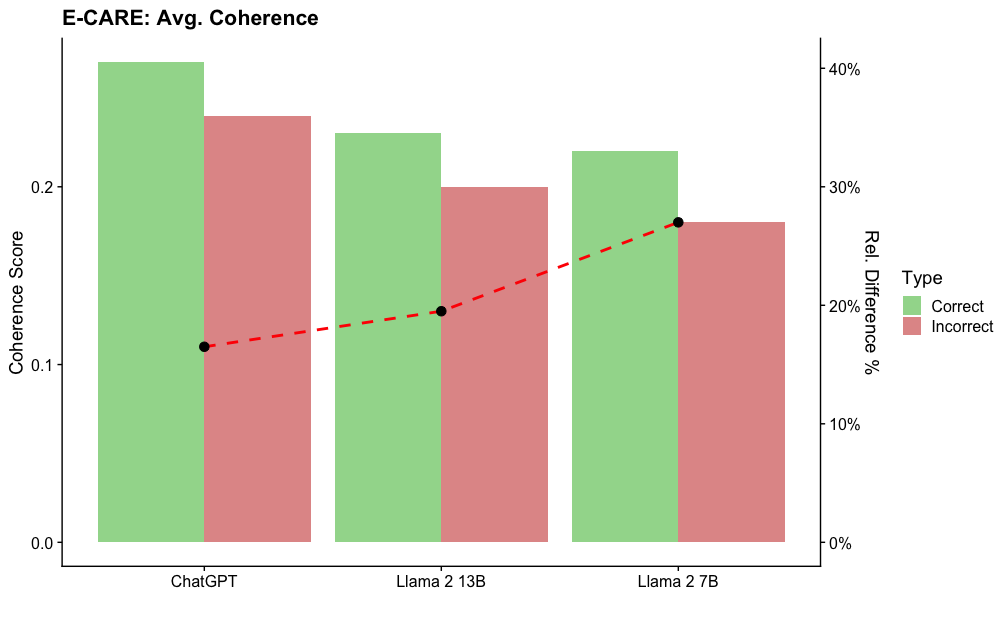
This bar chart compares the average coherence scores of three language models – ChatGPT, Llama 2 13B, and Llama 2 7B – alongside a line representing the relative difference in percentage between correct and incorrect responses. The chart aims to visualize the coherence of each model and the accuracy of their responses.
### Components/Axes
* **Title:** E-CARE: Avg. Coherence (top-center)
* **X-axis:** Language Models (ChatGPT, Llama 2 13B, Llama 2 7B)
* **Y-axis (left):** Coherence Score (ranging from approximately 0.0 to 0.25)
* **Y-axis (right):** Rel. Difference % (ranging from 0% to 40%)
* **Legend (top-right):**
* Type: Correct (Green)
* Type: Incorrect (Red)
* **Data Series:**
* Bar Chart: Average Coherence Score for each model (Green for Correct, Red for Incorrect)
* Line Chart: Relative Difference (%) between Correct and Incorrect responses (dashed red line with black markers)
### Detailed Analysis
The chart presents three sets of paired bars, one for each language model. Each model has a green bar representing the "Correct" responses and a red bar representing the "Incorrect" responses. A dashed red line with black markers connects the relative difference percentages for each model.
* **ChatGPT:**
* Correct (Green): Approximately 0.23
* Incorrect (Red): Approximately 0.12
* Relative Difference (%): Approximately 16%
* **Llama 2 13B:**
* Correct (Green): Approximately 0.25
* Incorrect (Red): Approximately 0.20
* Relative Difference (%): Approximately 25%
* **Llama 2 7B:**
* Correct (Green): Approximately 0.23
* Incorrect (Red): Approximately 0.32
* Relative Difference (%): Approximately 31%
The dashed red line shows an upward trend, indicating that the relative difference between correct and incorrect responses increases from ChatGPT to Llama 2 7B.
### Key Observations
* Llama 2 13B exhibits the highest average coherence score for correct responses.
* Llama 2 7B has the lowest average coherence score for correct responses and the highest for incorrect responses.
* The relative difference between correct and incorrect responses is lowest for ChatGPT and highest for Llama 2 7B.
* The line representing the relative difference shows a clear increasing trend.
### Interpretation
The data suggests that while Llama 2 13B demonstrates the highest coherence in correct responses, Llama 2 7B has a larger discrepancy between the coherence of correct and incorrect responses. This could indicate that Llama 2 7B is more prone to generating incoherent incorrect responses compared to the other two models. ChatGPT shows a moderate coherence score with a relatively low difference between correct and incorrect responses, suggesting a more consistent level of coherence across both types of responses. The increasing trend in the relative difference line implies that as the model size decreases (from 13B to 7B), the ability to maintain coherence in correct responses diminishes while the incoherence in incorrect responses increases. This could be due to the smaller model having less capacity to learn and generalize from the training data, leading to more erratic outputs. The E-CARE metric appears to be sensitive to the quality of responses, and this chart provides a comparative assessment of the three models based on this metric.