## Bar Chart with Line Overlay: E-CARE: Avg. Coherence
### Overview
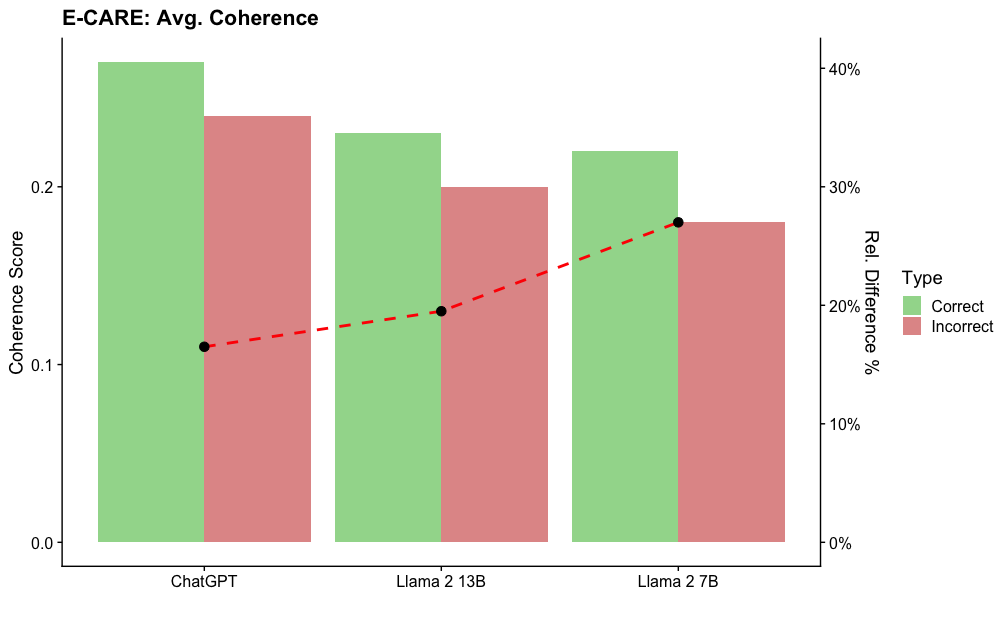
The image is a combination bar and line chart titled "E-CARE: Avg. Coherence". It compares the average coherence scores for "Correct" and "Incorrect" responses across three different large language models: ChatGPT, Llama 2 13B, and Llama 2 7B. A secondary axis shows the relative percentage difference between the correct and incorrect scores for each model.
### Components/Axes
* **Title:** "E-CARE: Avg. Coherence" (Top-left, bold).
* **Primary Y-Axis (Left):** Labeled "Coherence Score". Scale ranges from 0.0 to just above 0.2, with major ticks at 0.0, 0.1, and 0.2.
* **Secondary Y-Axis (Right):** Labeled "Rel. Difference %". Scale ranges from 0% to 40%, with major ticks at 0%, 10%, 20%, 30%, and 40%.
* **X-Axis:** Lists three model names: "ChatGPT", "Llama 2 13B", and "Llama 2 7B".
* **Legend:** Positioned on the right side, between the two y-axes. It defines the bar colors under the header "Type":
* Green square: "Correct"
* Red square: "Incorrect"
* **Data Series:**
1. **Bar Series (Correct):** Light green bars.
2. **Bar Series (Incorrect):** Light red/salmon bars.
3. **Line Series:** A red dashed line with black circular markers at each data point, corresponding to the right y-axis ("Rel. Difference %").
### Detailed Analysis
**Bar Data (Coherence Score - Left Axis):**
* **ChatGPT:**
* Correct (Green Bar): Approximately 0.24.
* Incorrect (Red Bar): Approximately 0.22.
* **Llama 2 13B:**
* Correct (Green Bar): Approximately 0.22.
* Incorrect (Red Bar): Approximately 0.20.
* **Llama 2 7B:**
* Correct (Green Bar): Approximately 0.21.
* Incorrect (Red Bar): Approximately 0.18.
**Line Data (Relative Difference % - Right Axis):**
The red dashed line shows an upward trend from left to right.
* **ChatGPT:** The black dot aligns with approximately 17% on the right axis.
* **Llama 2 13B:** The black dot aligns with approximately 19% on the right axis.
* **Llama 2 7B:** The black dot aligns with approximately 28% on the right axis.
**Trend Verification:**
* For all three models, the green "Correct" bar is taller than the red "Incorrect" bar, indicating higher coherence scores for correct answers.
* The height of both the green and red bars decreases progressively from ChatGPT to Llama 2 13B to Llama 2 7B.
* The red dashed line (Relative Difference) slopes upward, indicating the percentage gap between correct and incorrect coherence scores increases as we move from ChatGPT to the smaller Llama models.
### Key Observations
1. **Consistent Performance Gap:** Every model exhibits a higher average coherence score for its correct responses compared to its incorrect ones.
2. **Model Size Correlation:** There is a visible trend where the absolute coherence scores (for both correct and incorrect) are highest for ChatGPT, lower for Llama 2 13B, and lowest for Llama 2 7B.
3. **Increasing Disparity:** The relative difference (gap) between correct and incorrect coherence is smallest for ChatGPT (~17%) and largest for Llama 2 7B (~28%). This suggests the performance disparity grows as model size decreases within the Llama 2 family.
4. **Visual Layout:** The legend is placed in the right margin. The bars are grouped by model, with the "Correct" bar always to the left of the "Incorrect" bar for each model. The line chart is overlaid on the bar chart, with its markers centered over each model group.
### Interpretation
This chart from the E-CARE benchmark suggests a relationship between a model's overall capability and the consistency of its output coherence. Larger or more capable models (like ChatGPT in this comparison) not only achieve higher absolute coherence scores but also maintain a more consistent level of coherence between their correct and incorrect answers. The increasing relative difference for smaller models (Llama 2 13B and 7B) indicates that when these models make errors, the coherence of their reasoning or output degrades more sharply compared to their correct responses. This could imply that model scale contributes to more robust and stable generation quality, even in failure modes. The data highlights that evaluating models on correct answers alone may not capture the full picture of their reliability; the quality of their errors is also a critical metric.