## Line Charts: Early Stopping Step and Loss Trends
### Overview
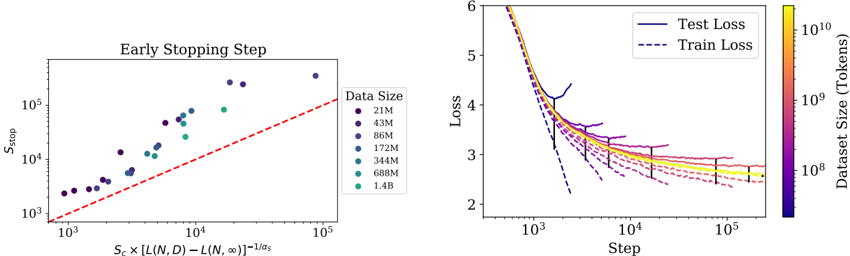
The image contains two line charts. The left chart ("Early Stopping Step") plots early stopping steps against a derived metric involving dataset size and loss. The right chart compares training and test loss across training steps for datasets of varying sizes. Both charts use logarithmic scales and color-coded data series.
### Components/Axes
#### Left Chart ("Early Stopping Step"):
- **X-axis**: "S_c × [L(N,D) − L(N,∞)]^(-1/α_s)" (log scale, 10³ to 10⁵)
- **Y-axis**: "S_stop" (log scale, 10³ to 10⁵)
- **Legend**: Located on the right, mapping colors to dataset sizes:
- Purple: 21M
- Dark blue: 43M
- Medium blue: 86M
- Teal: 172M
- Light teal: 344M
- Green: 688M
- Yellow: 1.4B
- **Trend line**: Red dashed line (approximate equation: y = x)
#### Right Chart ("Loss Trends"):
- **X-axis**: "Step" (log scale, 10³ to 10⁵)
- **Y-axis**: "Loss" (log scale, 2 to 6)
- **Lines**:
- Solid blue: Test Loss
- Dashed blue: Train Loss
- **Color gradient**: Right axis maps colors to dataset sizes (same as left chart legend).
### Detailed Analysis
#### Left Chart:
- Data points (dots) align closely with the red dashed trend line, confirming the relationship:
**S_stop ∝ S_c × [L(N,D) − L(N,∞)]^(-1/α_s)**.
- Larger datasets (e.g., 1.4B, yellow) have higher S_stop values, while smaller datasets (e.g., 21M, purple) cluster at lower S_stop values.
#### Right Chart:
- **Test Loss** (solid lines) consistently exceeds **Train Loss** (dashed lines) across all dataset sizes.
- Losses decrease sharply at early steps (10³–10⁴) and plateau near step 10⁵.
- Larger datasets (yellow) achieve lower loss values than smaller datasets (purple), indicating better generalization.
### Key Observations
1. **Early Stopping Correlation**: The red dashed line in the left chart validates the theoretical relationship between S_stop and dataset size.
2. **Loss Convergence**: All datasets converge to similar loss values at later steps, but larger datasets start with lower loss.
3. **Dataset Size Impact**: Larger datasets (1.4B) outperform smaller ones in both metrics (higher S_stop and lower loss).
### Interpretation
- The left chart demonstrates that early stopping steps scale with dataset size and the gap between finite and infinite-sample loss, suggesting adaptive stopping criteria for larger datasets.
- The right chart reveals that larger datasets achieve faster and more stable convergence, reducing overfitting (Test Loss ≈ Train Loss at later steps). Smaller datasets show higher variance in loss, indicating instability.
- The consistent color coding across both charts allows direct comparison: datasets with higher S_stop (left) also achieve lower loss (right), reinforcing the value of larger datasets in training efficiency.