## Network Diagram: Layered Network Visualization
### Overview
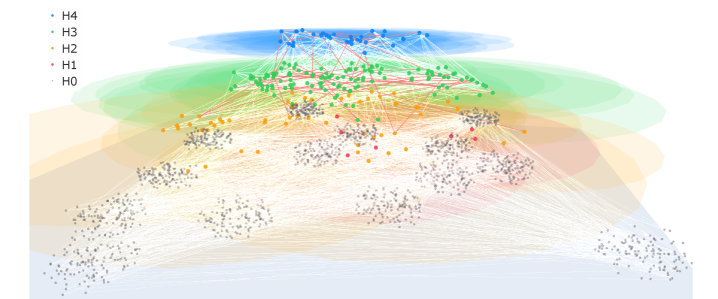
The image presents a layered network diagram. Nodes are grouped into five distinct layers, labeled H0 through H4, each represented by a different color. Connections between nodes are indicated by lines, with a higher density of connections within each layer and some connections spanning across layers. The layers are visually separated by translucent, colored ovals.
### Components/Axes
* **Layers:** The network is structured into five layers, labeled H0, H1, H2, H3, and H4.
* **Nodes:** Each layer contains multiple nodes, represented by small circles.
* **Connections:** Lines connect nodes, indicating relationships or interactions.
* **Color Coding:**
* H4: Blue
* H3: Green
* H2: Yellow/Orange
* H1: Red/Pink
* H0: Gray
### Detailed Analysis or ### Content Details
* **Layer H4 (Blue):** Located at the top of the diagram, this layer contains a cluster of nodes with dense interconnections.
* **Layer H3 (Green):** Situated below H4, this layer also exhibits a cluster of nodes with dense interconnections. There are red lines connecting this layer to the H4 layer above.
* **Layer H2 (Yellow/Orange):** Positioned below H3, this layer shows a less dense cluster of nodes compared to H3 and H4. There are red lines connecting this layer to the H3 layer above.
* **Layer H1 (Red/Pink):** Located below H2, this layer has a sparse distribution of nodes, with some nodes appearing in clusters.
* **Layer H0 (Gray):** Situated at the bottom, this layer contains the largest number of nodes, distributed in several clusters.
**Node Distribution and Connectivity:**
* The top layers (H4 and H3) have a more concentrated node distribution.
* The bottom layers (H0 and H1) have a more dispersed node distribution.
* Connections between layers are primarily indicated by red lines.
### Key Observations
* The network exhibits a hierarchical structure, with layers stacked vertically.
* Node density and connectivity vary across layers.
* The color-coding scheme helps distinguish between layers.
* The red lines indicate connections between layers.
### Interpretation
The network diagram likely represents a system with multiple levels of organization or abstraction. The layers (H0-H4) could represent different levels of a hierarchy, stages in a process, or categories of entities. The connections between nodes indicate relationships or interactions within and between these layers. The higher density of connections in the upper layers (H4 and H3) might suggest a greater degree of integration or coordination at those levels. The sparser distribution of nodes in the lower layers (H0 and H1) could indicate a more diverse or fragmented set of entities at those levels. The red lines connecting the layers suggest dependencies or information flow between the levels.