## Network Diagram: Hierarchical Layer Visualization
### Overview
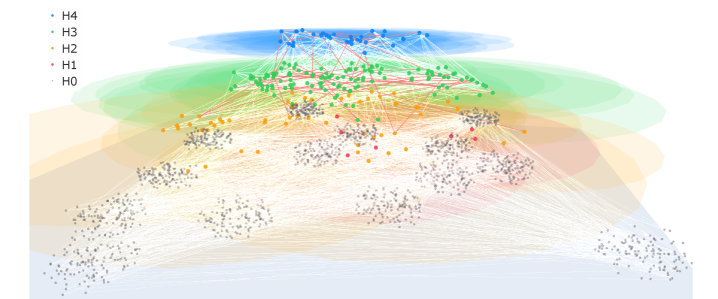
The image displays a complex, multi-layered network diagram or graph visualization. It depicts a hierarchical system with nodes (points) and edges (connecting lines) organized into five distinct layers, labeled H4 through H0. The visualization uses color-coding and spatial positioning to represent different levels within the hierarchy, showing dense interconnections between layers.
### Components/Axes
* **Legend (Top-Left Corner):** A vertical list defining the color code for each hierarchical level.
* **H4:** Blue dot
* **H3:** Green dot
* **H2:** Orange dot
* **H1:** Red dot
* **H0:** Gray dot
* **Layers (Spatial Arrangement):** The diagram is organized vertically, with the highest level (H4) at the top and the base level (H0) at the bottom.
* **H4 Layer (Top):** A cluster of blue nodes concentrated in the upper-center region, overlaid on a faint blue background shape.
* **H3 Layer:** A cluster of green nodes positioned below the H4 layer, overlaid on a faint green background shape.
* **H2 Layer:** A cluster of orange nodes in the middle section, overlaid on a faint orange background shape.
* **H1 Layer:** A smaller set of red nodes, primarily located within or near the H2 layer, overlaid on a faint red background shape.
* **H0 Layer (Bottom):** A large, dense collection of gray nodes forming the base of the diagram, spread across the lower half.
* **Edges (Connections):** A dense web of lines connects nodes across different layers. The edge colors often correspond to the color of the source or target node, creating a gradient effect (e.g., blue-to-green, green-to-orange, orange-to-gray lines are visible).
### Detailed Analysis
* **Node Distribution:** The number of nodes increases dramatically from the top layer to the bottom. H4 (blue) has the fewest nodes, followed by H3 (green), H2 (orange), and H1 (red). H0 (gray) contains the vast majority of nodes, forming a broad, dense foundation.
* **Connection Density:** The network is highly interconnected. There is a particularly dense mesh of connections between adjacent layers (e.g., H4 to H3, H3 to H2, H2 to H0). Connections also exist between non-adjacent layers (e.g., H4 to H2), but appear less frequent.
* **Spatial Grounding & Color Verification:**
* The **blue nodes (H4)** are exclusively in the top region.
* The **green nodes (H3)** form a distinct band below the blue cluster.
* The **orange nodes (H2)** are centrally located, with **red nodes (H1)** interspersed among them, primarily on the right side of the orange cluster.
* The **gray nodes (H0)** are distributed across the entire bottom half, with some clusters appearing denser than others.
* The background color fields (blue, green, orange, red) roughly align with the spatial zones of their corresponding node clusters, providing a visual grouping cue.
### Key Observations
1. **Hierarchical Pyramid Structure:** The visualization clearly depicts a pyramid-like hierarchy, where a small number of high-level elements (H4) connect to a progressively larger number of elements at lower levels, culminating in a massive base layer (H0).
2. **Layer Integration:** While layers are distinct, the H1 (red) nodes are not a separate, full layer but are embedded within the H2 (orange) layer, suggesting they may be a special subset or a transitional category.
3. **Asymmetric Clustering:** The gray H0 nodes are not uniformly distributed; they form several distinct clusters or communities, particularly on the left and right sides of the diagram's base.
4. **Edge Color Gradient:** The connecting lines often show a color transition, visually reinforcing the flow or relationship from one hierarchical level to another.
### Interpretation
This diagram is a classic representation of a **hierarchical network or taxonomy**. It likely models a system where a few core concepts, categories, or control units (H4) branch out into more specific sub-categories (H3, H2), which in turn govern or connect to a vast array of individual data points, instances, or leaf nodes (H0).
* **What it Suggests:** The structure implies a top-down organization of information or control. The high density of connections, especially between H2/H1 and H0, indicates that the middle layers act as critical hubs or classifiers that mediate between the abstract top and the concrete bottom.
* **Relationships:** The primary relationship is **containment and connection**. Higher-level nodes are connected to, and likely summarize or control, multiple lower-level nodes. The embedded H1 (red) nodes within H2 might represent exceptions, high-priority items, or a different type of entity within that category.
* **Notable Anomalies:** The key anomaly is the non-uniform distribution of H0 nodes. The clustered nature of the base layer suggests the system has inherent communities or sub-groups at its most granular level, which are then connected upward through the hierarchy. This is not a perfectly uniform tree but a complex, community-structured network.
**Language Note:** All text in the image is in English.