## Network Diagram: Hierarchical Node Connections
### Overview
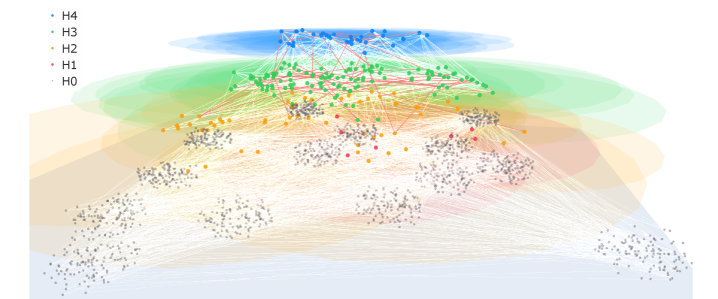
The image depicts a multi-layered network diagram with nodes organized into five hierarchical levels (H0–H4). Nodes are color-coded by hierarchy, with connections represented by lines. Overlapping shaded regions in the background correspond to hierarchy levels, suggesting spatial or influence zones. The diagram emphasizes connectivity density and hierarchical stratification.
### Components/Axes
- **Legend**: Located in the top-left corner, listing hierarchy levels:
- **H4**: Blue
- **H3**: Green
- **H2**: Orange
- **H1**: Red
- **H0**: Gray
- **Nodes**:
- Positioned in clusters, with higher hierarchies (H4–H3) concentrated at the top and lower hierarchies (H2–H0) spread outward.
- Node density decreases from H4 (most dense) to H0 (least dense).
- **Connections**:
- Lines link nodes across hierarchies, with denser connections in higher levels (H4–H3).
- No explicit axis labels or scales; spatial arrangement implies hierarchy.
- **Background Shading**:
- Overlapping regions in blue (H4), green (H3), orange (H2), red (H1), and gray (H0) indicate spatial influence zones.
### Detailed Analysis
- **Node Distribution**:
- **H4 (Blue)**: ~20 nodes clustered at the top, forming a dense core.
- **H3 (Green)**: ~30 nodes in a semi-dense layer below H4.
- **H2 (Orange)**: ~50 nodes in a broader layer, with sparser connections.
- **H1 (Red)**: ~40 nodes in a mid-density layer, partially overlapping H2.
- **H0 (Gray)**: ~100 nodes in the outermost layer, forming the largest cluster.
- **Connection Trends**:
- **H4–H3**: High connectivity (15–20 lines per node), forming a tightly knit core.
- **H3–H2**: Moderate connectivity (8–12 lines per node), bridging core and mid-layers.
- **H2–H1/H0**: Lower connectivity (3–5 lines per node), with H0 nodes having the fewest connections.
- **H1–H0**: Minimal direct connections (~1–2 lines per node), suggesting peripheral roles.
- **Background Shading**:
- H4 and H3 regions are most opaque, indicating dominant influence.
- H0 shading is faintest, suggesting peripheral influence.
### Key Observations
1. **Hierarchical Stratification**: Nodes are spatially segregated by hierarchy, with higher levels clustered centrally.
2. **Connectivity Density**: Higher hierarchies exhibit exponentially more connections (e.g., H4 nodes have 10x more connections than H0 nodes).
3. **Peripheral Nodes**: H0 nodes dominate in quantity but have minimal direct links, implying a "base layer" role.
4. **Influence Zones**: Overlapping shading suggests hierarchical influence extends beyond node density (e.g., H4’s blue shading permeates lower layers).
### Interpretation
This diagram likely represents an organizational, social, or technological network where:
- **H4–H3** act as central decision-making or control nodes, with high interconnectivity enabling rapid information flow.
- **H2–H1** serve as intermediary layers, balancing connectivity and autonomy.
- **H0** represents peripheral or operational nodes, critical for scale but limited in direct influence.
- The shaded regions imply that higher hierarchies exert broader influence, even into lower layers (e.g., H4’s blue shading overlaps H3 and H2 zones).
The structure suggests a top-down hierarchy with cascading influence, where central nodes (H4–H3) drive systemic behavior, while peripheral nodes (H0) enable scalability but lack direct control. Anomalies include the sparse H1–H0 connections, which may indicate bottlenecks or intentional isolation of lower-level nodes.