## Bar Chart: Edit Distance vs. Noise Level
### Overview
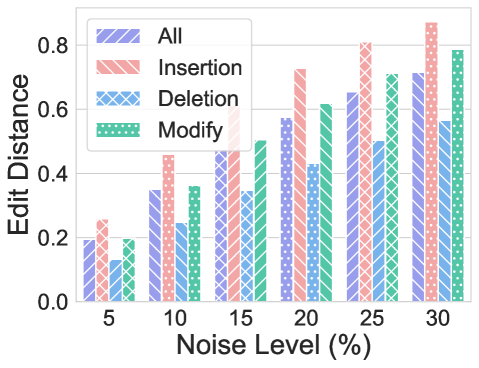
The image is a bar chart comparing the edit distance for different types of modifications (Insertion, Deletion, Modify) and the overall edit distance ("All") at varying noise levels (5% to 30%). The chart uses different patterned bars to represent each modification type.
### Components/Axes
* **X-axis:** Noise Level (%), with markers at 5, 10, 15, 20, 25, and 30.
* **Y-axis:** Edit Distance, ranging from 0.0 to 0.8, with gridlines at intervals of 0.2.
* **Legend (Top-Left):**
* "All" - Light purple bars with diagonal stripes.
* "Insertion" - Light red bars with small dots.
* "Deletion" - Light blue bars with a cross-hatch pattern.
* "Modify" - Light green bars with small dots.
### Detailed Analysis
Here's a breakdown of the edit distance for each modification type at different noise levels:
* **All (Light Purple with Diagonal Stripes):**
* 5%: ~0.2
* 10%: ~0.35
* 15%: ~0.48
* 20%: ~0.58
* 25%: ~0.65
* 30%: ~0.72
Trend: The "All" edit distance consistently increases as the noise level increases.
* **Insertion (Light Red with Small Dots):**
* 5%: ~0.27
* 10%: ~0.46
* 15%: ~0.48
* 20%: ~0.73
* 25%: ~0.72
* 30%: ~0.82
Trend: The "Insertion" edit distance generally increases with noise level, with a slight plateau between 20% and 25%.
* **Deletion (Light Blue with Cross-Hatch):**
* 5%: ~0.14
* 10%: ~0.25
* 15%: ~0.24
* 20%: ~0.43
* 25%: ~0.35
* 30%: ~0.57
Trend: The "Deletion" edit distance increases with noise level, but with some fluctuations.
* **Modify (Light Green with Small Dots):**
* 5%: ~0.19
* 10%: ~0.36
* 15%: ~0.34
* 20%: ~0.62
* 25%: ~0.71
* 30%: ~0.79
Trend: The "Modify" edit distance generally increases with noise level.
### Key Observations
* The "Insertion" modification type has the highest edit distance at higher noise levels (20% and above).
* The "Deletion" modification type has the lowest edit distance across all noise levels.
* The "All" edit distance generally falls between the "Insertion" and "Deletion" values, as expected.
* All edit distances tend to increase as the noise level increases.
### Interpretation
The chart demonstrates how different types of modifications contribute to the overall edit distance as noise levels increase. The "Insertion" modifications appear to be the most sensitive to noise, resulting in the highest edit distances at higher noise levels. The "Deletion" modifications are less sensitive, resulting in lower edit distances. The "All" edit distance reflects the combined effect of all modification types. This data suggests that the "Insertion" operations are more prone to errors or changes when noise is introduced, while "Deletion" operations are more robust.