## Bar Chart: Edit Distance vs. Noise Level
### Overview
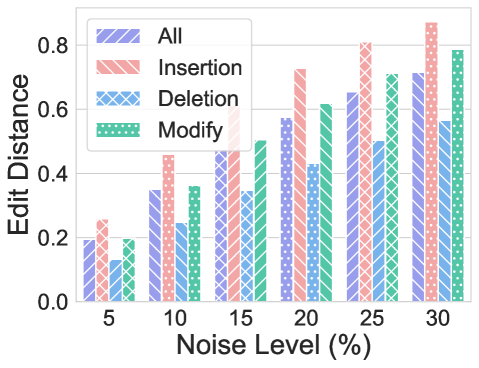
The image is a grouped bar chart displaying the relationship between "Noise Level (%)" and "Edit Distance" across four distinct categories: "All", "Insertion", "Deletion", and "Modify". The chart demonstrates how different types of data errors (or edits) scale as the input noise increases from 5% to 30%.
### Components/Axes
* **Y-Axis:** Labeled "Edit Distance". The scale ranges from 0.0 to 0.8, with grid lines at 0.0, 0.2, 0.4, 0.6, and 0.8.
* **X-Axis:** Labeled "Noise Level (%)". The axis displays discrete intervals: 5, 10, 15, 20, 25, and 30.
* **Legend (Positioned Top-Left):**
* **All:** Represented by purple bars with diagonal stripes.
* **Insertion:** Represented by red/pink bars with diagonal stripes.
* **Deletion:** Represented by blue bars with diagonal stripes.
* **Modify:** Represented by green bars with a dotted/stippled pattern.
### Detailed Analysis
**Trend Verification:** All four data series exhibit a clear, positive linear trend. As the "Noise Level (%)" increases from 5 to 30, the "Edit Distance" increases for every category.
**Data Points (Approximate Values):**
| Noise Level (%) | All (Purple) | Insertion (Red) | Deletion (Blue) | Modify (Green) |
| :--- | :--- | :--- | :--- | :--- |
| **5** | ~0.20 | ~0.25 | ~0.13 | ~0.20 |
| **10** | ~0.35 | ~0.45 | ~0.25 | ~0.36 |
| **15** | ~0.47 | ~0.60 | ~0.35 | ~0.50 |
| **20** | ~0.57 | ~0.72 | ~0.43 | ~0.61 |
| **25** | ~0.65 | ~0.80 | ~0.50 | ~0.71 |
| **30** | ~0.71 | ~0.87 | ~0.56 | ~0.78 |
### Key Observations
* **Highest Impact:** The "Insertion" category consistently produces the highest Edit Distance across all noise levels, indicating that insertion errors are the most significant contributor to the total edit distance in this dataset.
* **Lowest Impact:** The "Deletion" category consistently produces the lowest Edit Distance, suggesting it is the least frequent or least impactful error type among those measured.
* **Crossover/Clustering:** The "All" and "Modify" categories are clustered in the middle. At lower noise levels (5%), "All" and "Modify" are nearly identical. As noise increases, "Modify" consistently trends slightly higher than "All".
### Interpretation
The data demonstrates a predictable degradation of data integrity as noise levels increase. The system appears to be most sensitive to "Insertion" operations, which result in the highest edit distance.
From a Peircean investigative perspective, the fact that "Insertion" is consistently higher than "Deletion" and "Modify" suggests that the underlying process or algorithm being tested is inherently more prone to generating insertion errors when subjected to noise. The "All" category, which likely represents an aggregate metric, tracks closely with the "Modify" category, suggesting that "Modify" errors may be the most representative "average" error type, whereas "Insertion" acts as an outlier on the high end and "Deletion" acts as an outlier on the low end.