## Grouped Bar Chart: Edit Distance vs. Noise Level by Operation Type
### Overview
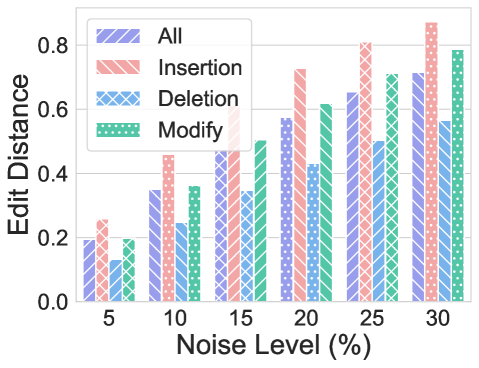
This is a grouped bar chart illustrating the relationship between increasing noise levels (as a percentage) and the resulting "Edit Distance" for four different categories of operations: All, Insertion, Deletion, and Modify. The chart includes error bars on each bar, indicating variability or confidence intervals around the mean edit distance measurements.
### Components/Axes
* **Chart Type:** Grouped bar chart with error bars.
* **X-Axis:** Labeled **"Noise Level (%)"**. It has six discrete categories: **5, 10, 15, 20, 25, 30**.
* **Y-Axis:** Labeled **"Edit Distance"**. The scale runs from **0.0 to 0.8**, with major tick marks at intervals of 0.2.
* **Legend:** Positioned in the **top-left corner** of the chart area. It defines four data series with distinct colors and patterns:
* **All:** Purple bars with diagonal stripes (\\).
* **Insertion:** Red bars with diagonal stripes (//).
* **Deletion:** Blue bars with a cross-hatch pattern (XX).
* **Modify:** Green bars with a dotted pattern (..).
### Detailed Analysis
Data values are approximate, read from the chart's visual alignment with the y-axis. Error bars represent the uncertainty range.
**At 5% Noise Level:**
* **All (Purple):** ~0.20 (Error bar range: ~0.18 to 0.22)
* **Insertion (Red):** ~0.25 (Error bar range: ~0.23 to 0.27)
* **Deletion (Blue):** ~0.12 (Error bar range: ~0.10 to 0.14)
* **Modify (Green):** ~0.20 (Error bar range: ~0.18 to 0.22)
**At 10% Noise Level:**
* **All (Purple):** ~0.35 (Error bar range: ~0.33 to 0.37)
* **Insertion (Red):** ~0.45 (Error bar range: ~0.43 to 0.47)
* **Deletion (Blue):** ~0.24 (Error bar range: ~0.22 to 0.26)
* **Modify (Green):** ~0.37 (Error bar range: ~0.35 to 0.39)
**At 15% Noise Level:**
* **All (Purple):** ~0.48 (Error bar range: ~0.46 to 0.50)
* **Insertion (Red):** ~0.60 (Error bar range: ~0.58 to 0.62)
* **Deletion (Blue):** ~0.35 (Error bar range: ~0.33 to 0.37)
* **Modify (Green):** ~0.50 (Error bar range: ~0.48 to 0.52)
**At 20% Noise Level:**
* **All (Purple):** ~0.58 (Error bar range: ~0.56 to 0.60)
* **Insertion (Red):** ~0.73 (Error bar range: ~0.71 to 0.75)
* **Deletion (Blue):** ~0.43 (Error bar range: ~0.41 to 0.45)
* **Modify (Green):** ~0.62 (Error bar range: ~0.60 to 0.64)
**At 25% Noise Level:**
* **All (Purple):** ~0.65 (Error bar range: ~0.63 to 0.67)
* **Insertion (Red):** ~0.80 (Error bar range: ~0.78 to 0.82)
* **Deletion (Blue):** ~0.50 (Error bar range: ~0.48 to 0.52)
* **Modify (Green):** ~0.71 (Error bar range: ~0.69 to 0.73)
**At 30% Noise Level:**
* **All (Purple):** ~0.71 (Error bar range: ~0.69 to 0.73)
* **Insertion (Red):** ~0.87 (Error bar range: ~0.85 to 0.89)
* **Deletion (Blue):** ~0.56 (Error bar range: ~0.54 to 0.58)
* **Modify (Green):** ~0.79 (Error bar range: ~0.77 to 0.81)
### Key Observations
1. **Universal Upward Trend:** For all four categories (All, Insertion, Deletion, Modify), the Edit Distance increases monotonically as the Noise Level increases from 5% to 30%.
2. **Operation Sensitivity Hierarchy:** There is a clear and consistent hierarchy in the magnitude of Edit Distance across all noise levels:
* **Insertion (Red)** consistently has the **highest** Edit Distance.
* **Deletion (Blue)** consistently has the **lowest** Edit Distance.
* **Modify (Green)** and **All (Purple)** fall in between, with Modify generally slightly higher than All.
3. **Divergence with Noise:** The gap between the operation types widens as noise increases. At 5% noise, the spread between the highest (Insertion) and lowest (Deletion) is ~0.13. At 30% noise, this spread increases to ~0.31.
4. **Error Bar Consistency:** The error bars are relatively small and consistent in size across all data points, suggesting stable measurements with low variance at each condition.
### Interpretation
This chart demonstrates the impact of data noise on the performance or cost of different edit operations, measured by "Edit Distance." The key finding is that **insertion operations are disproportionately affected by noise compared to deletion or modification operations.**
* **What the data suggests:** The system or model being evaluated becomes less accurate (higher edit distance) as input data becomes noisier. However, it is particularly vulnerable to errors that manifest as insertions. This could imply that the system has a bias towards adding extraneous information when confused by noise, or that its mechanism for handling insertions is less robust.
* **Relationship between elements:** The "All" category represents an aggregate metric. Its value being between the extremes of Insertion and Deletion/Modify confirms it is a composite measure. The fact that "Modify" tracks closely with but is slightly higher than "All" suggests modification errors are a significant component of the overall error profile.
* **Notable trends/anomalies:** The most significant trend is the linear-like increase for all series. There are no sudden jumps or plateaus, indicating a predictable, proportional relationship between noise and error within the tested range. The lack of any crossover in the hierarchy of the bars (Insertion always on top, Deletion always on bottom) is a strong, unambiguous result. The widening gap suggests that noise doesn't just increase errors uniformly; it specifically exacerbates the system's weakness in handling insertions.