## Histogram: CLUTRR cost histogram
### Overview
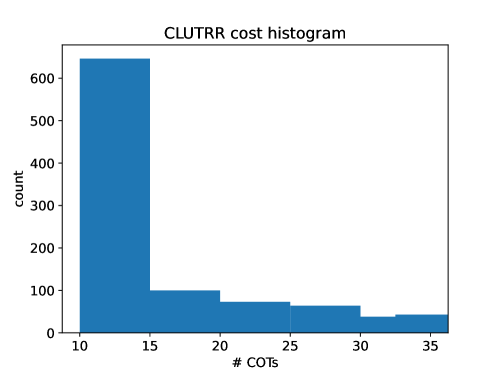
The image is a histogram titled "CLUTRR cost histogram" displaying the distribution of COT (Cost of Transaction) counts. The x-axis represents the number of COTs, while the y-axis represents the count of occurrences. The data is visualized using blue bars, with a clear trend of decreasing frequency as the number of COTs increases.
### Components/Axes
- **Title**: "CLUTRR cost histogram" (top center).
- **X-axis**: Labeled "# COTs" with values ranging from 10 to 35 in increments of 5.
- **Y-axis**: Labeled "count" with values ranging from 0 to 600 in increments of 100.
- **Bars**: Blue-colored bars representing the frequency of each COT count. No legend is visible in the image.
### Detailed Analysis
- **# COTs = 10**: The tallest bar, with a count of approximately **650**.
- **# COTs = 15**: A bar with a count of approximately **100**.
- **# COTs = 20**: A bar with a count of approximately **80**.
- **# COTs = 25**: A bar with a count of approximately **60**.
- **# COTs = 30**: A bar with a count of approximately **40**.
- **# COTs = 35**: A bar with a count of approximately **30**.
### Key Observations
- The distribution is **heavily skewed** toward lower COT counts, with the majority of occurrences concentrated at **10 COTs**.
- There is a **sharp drop-off** in frequency from 10 to 15 COTs, followed by a **gradual decline** as COT counts increase.
- The highest frequency (650) at 10 COTs suggests a dominant pattern, while higher COT counts (e.g., 35) are significantly less common.
### Interpretation
The data indicates that **most COT instances are associated with low transaction counts** (around 10), implying a potential optimization or efficiency in the system for smaller transaction volumes. The sharp decline in frequency for higher COT counts suggests that **higher transaction volumes are rare or less common**, which could reflect either:
1. **Efficiency**: The system is designed to handle smaller transactions more frequently.
2. **Bottlenecks**: Higher COT counts may represent outliers or inefficiencies in specific cases.
3. **Data skew**: The distribution might be influenced by a small subset of high-volume transactions.
The absence of a legend or additional annotations limits contextual interpretation, but the visual trend strongly emphasizes the dominance of low COT counts. This could inform decisions about resource allocation, system optimization, or anomaly detection in transactional data.