## Chart: Importance Score vs. Reasoning Step
### Overview
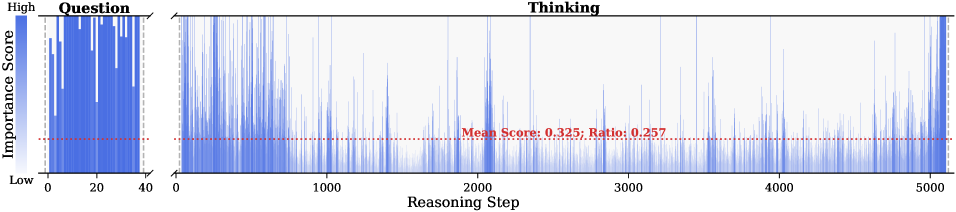
The image presents a chart visualizing the "Importance Score" over "Reasoning Step". The chart appears to represent the importance of each reasoning step during a question-answering or problem-solving process. The chart is divided into two phases: "Question" and "Thinking".
### Components/Axes
* **X-axis:** "Reasoning Step", ranging from 0 to 5000, with major tick marks at 0, 1000, 2000, 3000, 4000, and 5000.
* **Y-axis:** "Importance Score", ranging from "Low" to "High". The axis is not numerically scaled.
* **Chart Title:** Not explicitly present, but the chart represents the relationship between Reasoning Step and Importance Score.
* **Phase Labels:** "Question" (from 0 to approximately 40 Reasoning Steps) and "Thinking" (from approximately 40 to 5000 Reasoning Steps).
* **Mean Score Line:** A horizontal dashed red line indicating a "Mean Score: 0.325; Ratio: 0.257".
* **Data Series:** A single series of vertical bars representing the Importance Score at each Reasoning Step.
### Detailed Analysis
The chart shows a distinct difference in Importance Score between the "Question" and "Thinking" phases.
* **Question Phase (0-40 Reasoning Steps):** The Importance Score is initially high, with many bars reaching near the "High" end of the scale. The score rapidly decreases as the Reasoning Step increases, becoming relatively low by step 40. The bars are densely packed and vary significantly in height.
* **Thinking Phase (40-5000 Reasoning Steps):** The Importance Score fluctuates around the Mean Score line (0.325). The bars are generally shorter and more uniformly distributed, with occasional spikes reaching higher values. The fluctuations appear somewhat random.
**Approximate Data Points (based on visual estimation):**
* **Reasoning Step 0:** Importance Score is approximately 0.8-0.9.
* **Reasoning Step 10:** Importance Score is approximately 0.6-0.7.
* **Reasoning Step 20:** Importance Score is approximately 0.4-0.5.
* **Reasoning Step 30:** Importance Score is approximately 0.2-0.3.
* **Reasoning Step 40:** Importance Score is approximately 0.1-0.2.
* **Reasoning Step 500:** Importance Score is approximately 0.3-0.4.
* **Reasoning Step 1000:** Importance Score is approximately 0.2-0.3.
* **Reasoning Step 2000:** Importance Score is approximately 0.3-0.4.
* **Reasoning Step 3000:** Importance Score is approximately 0.2-0.3.
* **Reasoning Step 4000:** Importance Score is approximately 0.3-0.4.
* **Reasoning Step 5000:** Importance Score is approximately 0.2-0.3.
### Key Observations
* The initial "Question" phase exhibits a rapid decline in Importance Score, suggesting that the initial steps of question processing are the most crucial.
* The "Thinking" phase shows a relatively stable, but fluctuating, Importance Score around the mean. This indicates that many reasoning steps contribute somewhat to the overall process, but none are overwhelmingly important.
* The Mean Score of 0.325 and Ratio of 0.257 provide a baseline for evaluating the importance of individual reasoning steps.
* There are occasional spikes in the "Thinking" phase, suggesting that certain reasoning steps are more critical than others.
### Interpretation
This chart likely represents the attention weights or importance scores assigned to each reasoning step in a large language model (LLM) or similar AI system during a question-answering task. The rapid decline in importance during the "Question" phase suggests that the initial steps of understanding the question and formulating a plan are the most critical. The more stable, fluctuating importance in the "Thinking" phase indicates that the subsequent reasoning steps contribute incrementally to the solution.
The Mean Score and Ratio likely represent the average importance score and some measure of the distribution of importance scores, respectively. The spikes in the "Thinking" phase could correspond to key insights or critical reasoning steps that significantly contribute to the final answer.
The chart suggests that the model initially focuses heavily on understanding the question, and then distributes its attention more broadly across a range of reasoning steps during the problem-solving process. The relatively low overall importance scores in the "Thinking" phase could indicate that the model relies on a distributed representation of knowledge and reasoning, rather than a few dominant steps.