## Line Chart: Question vs Thinking Importance Scores
### Overview
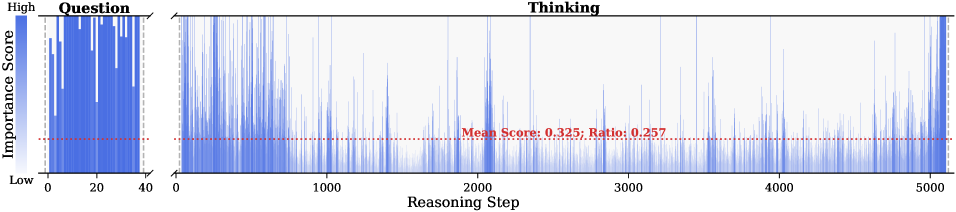
The image displays a dual-axis line chart comparing importance scores across reasoning steps. The left section ("Question") shows a vertical bar chart with importance scores, while the right section ("Thinking") presents a line plot with importance scores over reasoning steps. A red dashed horizontal line indicates a calculated mean score and ratio.
### Components/Axes
- **X-Axis (Horizontal):**
- Labeled "Reasoning Step"
- Scale: 0 to 5000 (discrete intervals)
- Subdivisions: Marked at 0, 1000, 2000, 3000, 4000, 5000
- **Y-Axis (Vertical):**
- Labeled "Importance Score"
- Scale: 0 (Low, white) to High (blue gradient)
- Color legend: Blue gradient from white (low) to dark blue (high)
- **Legend:**
- Position: Left side of the chart
- Indicates importance score gradient (no explicit labels beyond color)
- **Red Dashed Line:**
- Position: Horizontal across the entire chart
- Label: "Mean Score: 0.325; Ratio: 0.257" (centered text)
### Detailed Analysis
1. **Question Section (Left):**
- Vertical bars represent importance scores for discrete reasoning steps (0–40).
- Bars are densely packed, with most reaching the "High" end of the importance scale.
- No explicit numerical values, but visual density suggests high consistency in importance.
2. **Thinking Section (Right):**
- Line plot spans reasoning steps 0–5000.
- Importance scores fluctuate significantly, with sporadic spikes (e.g., ~1000, 2000, 4000 steps).
- Most scores cluster near the baseline (low importance), with occasional high peaks.
- Red dashed line intersects at:
- **Mean Score:** 0.325 (low on the importance scale)
- **Ratio:** 0.257 (suggesting a proportional relationship between Question and Thinking phases)
### Key Observations
- **High Importance in Question Phase:** The left section shows concentrated high-importance scores, indicating critical reasoning steps during the "Question" phase.
- **Volatile Importance in Thinking Phase:** The right section exhibits erratic spikes, suggesting sporadic high-importance moments during reasoning.
- **Mean vs. Ratio:** The mean score (0.325) is low, but the ratio (0.257) implies the Thinking phase's importance is a fraction of the Question phase's peak values.
- **Outliers:** Sharp spikes at ~1000, 2000, and 4000 steps in the Thinking phase may represent pivotal reasoning moments.
### Interpretation
The chart highlights a stark contrast between the structured, high-importance "Question" phase and the variable "Thinking" phase. The red dashed line contextualizes the Thinking phase's average importance (0.325) as a small fraction (25.7%) of the Question phase's peak values. This suggests that while the Question phase drives critical reasoning, the Thinking phase is characterized by intermittent bursts of insight rather than sustained importance. The ratio (0.257) quantifies this disparity, emphasizing the need for further analysis into why the Thinking phase exhibits such volatility despite lower average scores.