## Scatter Plot: Principal Component Analysis of Cognitive Tasks
### Overview
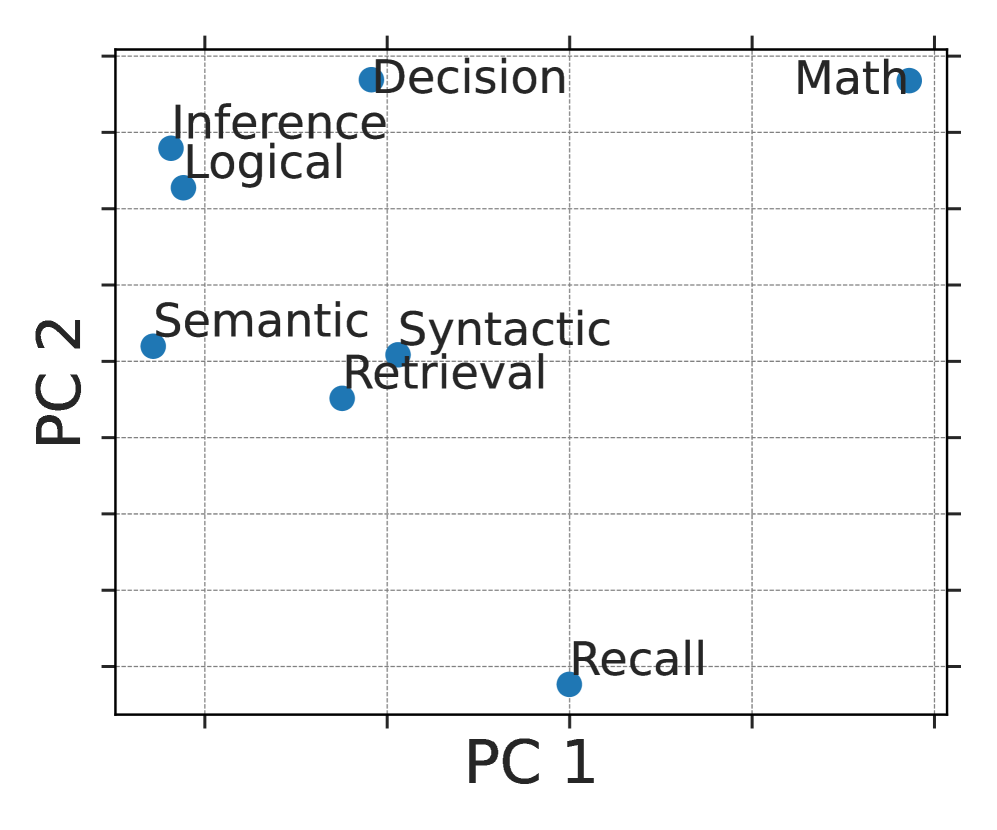
The image is a scatter plot visualizing the distribution of cognitive tasks across two principal components (PC1 and PC2). Points are labeled with task names, and their positions reflect their relative scores on the principal components. The plot uses a grid of dotted lines for spatial reference.
### Components/Axes
- **X-axis (PC1)**: Labeled "PC 1" with no numerical scale.
- **Y-axis (PC2)**: Labeled "PC 2" with no numerical scale.
- **Data Points**: Blue circular markers with labels for each task.
- **Grid**: Dotted lines forming a Cartesian coordinate system.
### Detailed Analysis
1. **Task Labels and Positions**:
- **Math**: Top-right quadrant (high PC1, high PC2).
- **Decision**: Upper-middle quadrant (moderate PC1, high PC2).
- **Inference**: Left-middle quadrant (low PC1, high PC2).
- **Logical**: Left-middle quadrant (low PC1, moderate PC2).
- **Semantic**: Lower-left quadrant (low PC1, low PC2).
- **Retrieval**: Lower-left quadrant (moderate PC1, low PC2).
- **Syntactic**: Center-left quadrant (moderate PC1, moderate PC2).
- **Recall**: Bottom-right quadrant (high PC1, low PC2).
2. **Spatial Distribution**:
- Points are spread across the plot, with no strict clustering.
- "Math" and "Decision" occupy the upper-right region, suggesting higher scores on both PC1 and PC2.
- "Recall" is isolated in the bottom-right, indicating high PC1 but low PC2.
- "Inference" and "Logical" cluster in the upper-left, sharing high PC2 but lower PC1.
- "Semantic" and "Retrieval" are in the lower-left, with lower scores on both axes.
- "Syntactic" is centrally located, reflecting moderate values on both components.
### Key Observations
- **Outliers**: "Recall" is the only point in the bottom-right quadrant, distinct from other tasks.
- **Trends**:
- Tasks like "Math" and "Decision" show elevated scores on both principal components.
- "Inference" and "Logical" share high PC2 but differ in PC1.
- "Semantic" and "Retrieval" cluster in the lower-left, suggesting similar underlying factors.
- **Grid Alignment**: All points align with the grid, but no numerical values are provided for PC1/PC2.
### Interpretation
This scatter plot likely represents a Principal Component Analysis (PCA) of cognitive or linguistic tasks, reducing multidimensional data to two axes. The positions of labeled points suggest:
- **PC1** may capture factors like computational complexity or memory demand (e.g., "Math" and "Recall" have high PC1).
- **PC2** might reflect aspects like reasoning or syntactic processing (e.g., "Inference" and "Logical" have high PC2).
- The distribution implies that tasks like "Math" and "Decision" share overlapping characteristics in both dimensions, while "Recall" is distinct in its PC1 dominance. The lack of numerical scales limits precise quantification, but the relative positions highlight potential groupings or contrasts among tasks.