## Scatter Plot: Principal Component Analysis of Cognitive Task Categories
### Overview
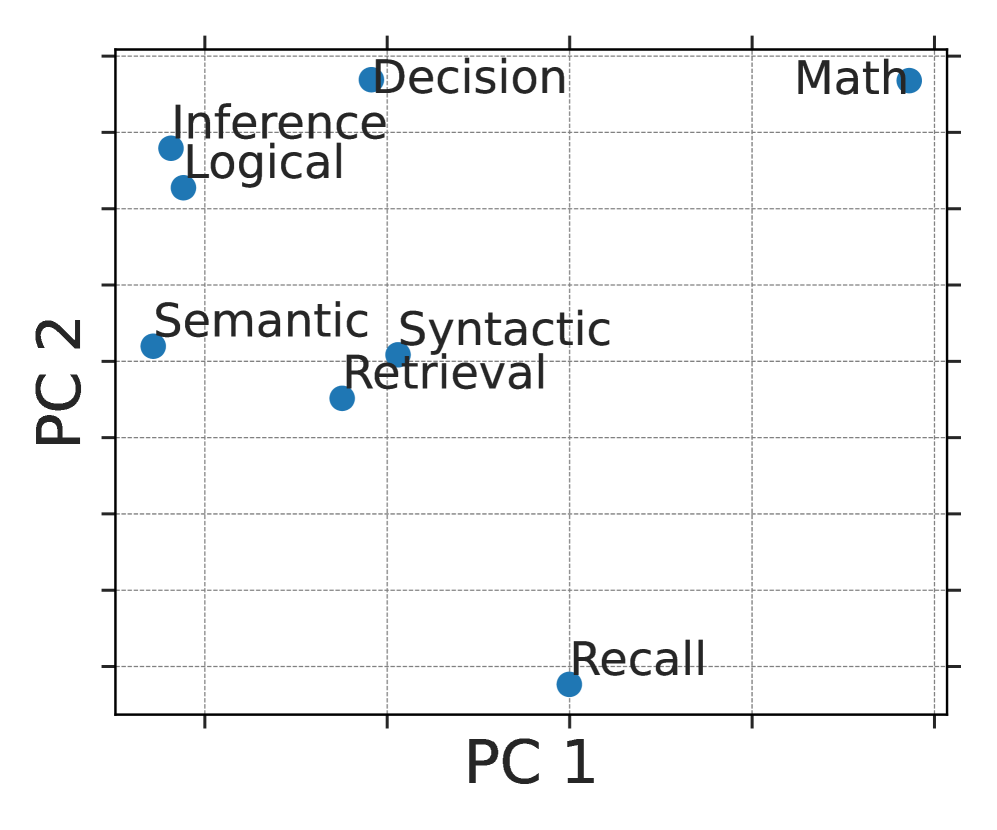
The image is a scatter plot visualizing the relationship between various cognitive or computational task categories along two principal components (PC 1 and PC 2). The plot uses blue circular markers to represent each category, with text labels placed adjacent to each point. The chart appears to be a dimensionality reduction output (like PCA) showing how different task types cluster or separate in a reduced feature space.
### Components/Axes
* **X-Axis (Horizontal):** Labeled "PC 1". It has a grid with major tick marks but no numerical scale provided.
* **Y-Axis (Vertical):** Labeled "PC 2". It also has a grid with major tick marks but no numerical scale provided.
* **Data Series:** A single series of data points, all represented by solid blue circles.
* **Legend:** There is no separate legend box. Each data point is directly labeled with its category name.
### Detailed Analysis
The plot contains eight distinct data points, each corresponding to a labeled category. Their approximate spatial positions are described below. Since no numerical axes are provided, positions are described qualitatively relative to the plot area.
1. **Math:** Located in the extreme **top-right corner** of the plot. It has the highest value on PC 1 and the highest value on PC 2 among all points.
2. **Decision:** Located in the **top-center** region. It has a high value on PC 2 (slightly lower than Math) and a moderate-to-high value on PC 1.
3. **Inference:** Located in the **top-left quadrant**. It has a high value on PC 2 and a low value on PC 1.
4. **Logical:** Positioned very close to and slightly below "Inference" in the **top-left quadrant**. It shares a similar high PC 2 value and low PC 1 value.
5. **Semantic:** Located in the **middle-left** area. It has a moderate value on PC 2 and a very low value on PC 1.
6. **Syntactic:** Located near the center of the plot, slightly to the right of "Semantic". It has a moderate value on PC 2 and a moderate value on PC 1.
7. **Retrieval:** Positioned just below and slightly left of "Syntactic", near the **center**. It has a moderate-to-low value on PC 2 and a moderate value on PC 1.
8. **Recall:** Located in the **bottom-center** region. It has the lowest value on PC 2 and a moderate value on PC 1.
**Spatial Grouping & Trend Verification:**
* **High PC 2 Cluster:** "Math", "Decision", "Inference", and "Logical" form a loose cluster in the upper half of the plot. "Math" is an outlier to the far right within this group.
* **Central/Moderate PC 2 Cluster:** "Semantic", "Syntactic", and "Retrieval" are grouped in the middle band of the plot.
* **Low PC 2 Outlier:** "Recall" is isolated at the bottom of the plot.
* **PC 1 Trend:** There is a general, non-linear trend where categories move from left (low PC 1) to right (high PC 1) as we go from "Semantic"/"Inference" towards "Math". "Recall" and "Decision" break this simple trend by having moderate PC 1 values despite their extreme PC 2 positions.
### Key Observations
1. **Distinct Separation:** The categories are well-separated in the 2D space, suggesting the two principal components capture meaningful variance between these task types.
2. **"Math" as an Extreme:** The "Math" category is the most distinct, being the furthest along both PC 1 and PC 2.
3. **"Recall" as an Extreme:** "Recall" is the most distinct in the negative PC 2 direction.
4. **Close Pairs:** "Inference" and "Logical" are very close, as are "Syntactic" and "Retrieval", suggesting high similarity in the underlying feature space for these pairs.
5. **Axis Interpretation (Inferred):** Without labeled scales, the axes' meaning is abstract. However, PC 1 might separate tasks requiring **external knowledge or formal systems** (high PC 1: Math, Decision) from those more based on **internal language processing** (low PC 1: Semantic, Inference). PC 2 might separate tasks requiring **active manipulation or generation** (high PC 2: Math, Decision, Inference) from those focused on **accessing stored information** (low PC 2: Recall, Retrieval).
### Interpretation
This scatter plot is a classic output of a dimensionality reduction technique applied to a dataset where each cognitive task was characterized by multiple features (e.g., performance metrics, neural activation patterns, or computational resource usage). The plot reveals the intrinsic structure of these tasks.
* **What it demonstrates:** The visualization suggests that these eight cognitive categories are not monolithic but exist on a continuum defined by at least two major underlying dimensions (PC 1 and PC 2). Tasks that are intuitively similar (like Inference and Logical reasoning) cluster together, validating the feature set used for the analysis.
* **Relationships:** The proximity of points indicates similarity. The large distance between "Math" and "Recall" implies these tasks are fundamentally different according to the analyzed features. The central position of "Syntactic" and "Retrieval" suggests they may share characteristics with both the high-PC2 and low-PC2 groups.
* **Anomalies/Notable Points:** The isolation of "Math" and "Recall" at opposite corners is the most striking feature. This could indicate that mathematical reasoning and pure recall represent two highly specialized and distinct cognitive modes within this model. The tight clustering of "Inference" and "Logical" suggests the analysis did not strongly differentiate between these often-related concepts.
**Language Note:** All text in the image is in English.