## Stacked Bar Chart: Pythia 6.9B
### Overview
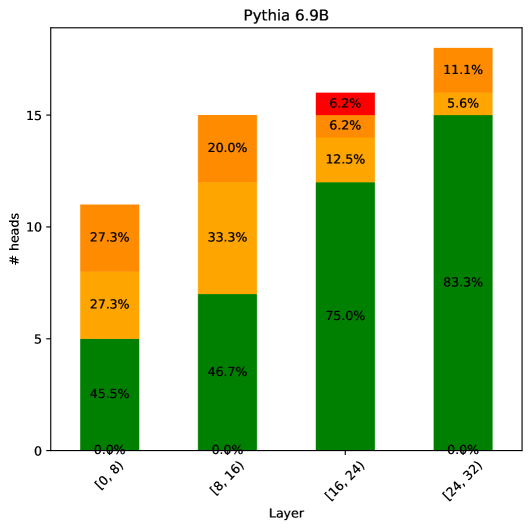
The image is a stacked bar chart titled "Pythia 6.9B". The chart displays the distribution of "# heads" across different "Layer" intervals. Each bar represents a layer interval, and the bar is segmented into colored sections, each representing a percentage. The y-axis represents the number of heads, ranging from 0 to 15. The x-axis represents the layer intervals: [0, 8), [8, 16), [16, 24), and [24, 32). The colors within each bar represent different categories, but the legend is missing, so the meaning of the colors is unknown.
### Components/Axes
* **Title:** Pythia 6.9B
* **Y-axis Label:** # heads
* **Y-axis Scale:** 0, 5, 10, 15
* **X-axis Label:** Layer
* **X-axis Categories:** [0, 8), [8, 16), [16, 24), [24, 32)
* **Colors:** Green, Orange, Yellow, Red (The meaning of these colors is not specified in the image)
### Detailed Analysis
The chart presents data for four layer intervals: [0, 8), [8, 16), [16, 24), and [24, 32). Each interval's bar is divided into colored segments, with percentages indicating the proportion of each segment.
* **Layer [0, 8):**
* Green: 45.5%
* Orange: 27.3%
* Yellow: 27.3%
* Red: 0.0%
* **Layer [8, 16):**
* Green: 46.7%
* Orange: 33.3%
* Yellow: 20.0%
* Red: 0.0%
* **Layer [16, 24):**
* Green: 75.0%
* Orange: 12.5%
* Yellow: 6.2%
* Red: 6.2%
* **Layer [24, 32):**
* Green: 83.3%
* Orange: 5.6%
* Yellow: 11.1%
* Red: 0.0%
### Key Observations
* The green segment increases significantly from layer [0, 8) to [24, 32), indicating a higher proportion in the later layers.
* The orange segment decreases from layer [8, 16) to [24, 32).
* The yellow segment decreases from layer [0, 8) to [16, 24) and then increases slightly in [24, 32).
* The red segment is only present in layer [16, 24).
### Interpretation
The stacked bar chart illustrates the distribution of "# heads" across different layers of the Pythia 6.9B model. The increasing proportion of the green segment suggests that the component represented by green becomes more dominant in later layers. The presence of the red segment only in layer [16, 24) indicates that the component represented by red is specific to that layer interval. Without a legend, the exact meaning of each color is unknown, but the chart clearly shows how the composition of "# heads" changes across different layers.