## Stacked Bar Chart: Pythia 6.9B Layer Analysis
### Overview
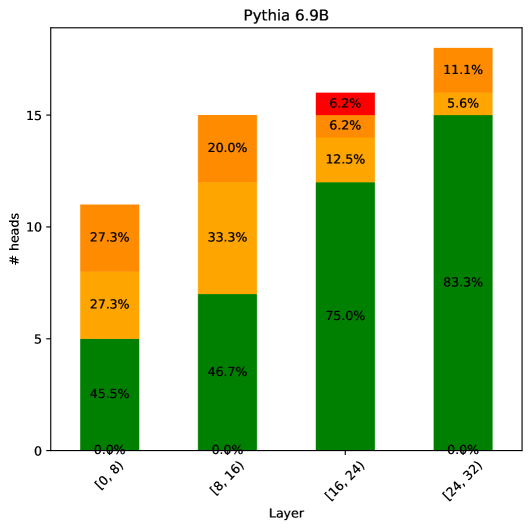
This is a stacked bar chart visualizing the distribution of "# heads" across different layers of the Pythia 6.9B model. The chart displays the percentage contribution of different components to the total number of heads within each layer. The x-axis represents the layer range, and the y-axis represents the number of heads. Each bar is segmented into colored sections representing percentage contributions.
### Components/Axes
* **Title:** Pythia 6.9B
* **X-axis Label:** Layer
* **X-axis Markers:** \[0, 8), \[8, 16), \[16, 24), \[24, 32)
* **Y-axis Label:** # heads
* **Colors/Legend (inferred from stacking order):**
* Dark Green: Represents the lowest percentage contribution within each bar.
* Green: Represents the second lowest percentage contribution.
* Orange: Represents the middle percentage contribution.
* Red: Represents the highest percentage contribution.
### Detailed Analysis
The chart consists of four stacked bars, one for each layer range.
* **Layer \[0, 8):**
* Dark Green: 45.5%
* Green: 27.3%
* Orange: 27.3%
* Red: 0.0%
* Total # heads: Approximately 10
* **Layer \[8, 16):**
* Dark Green: 46.7%
* Green: 33.3%
* Orange: 20.0%
* Red: 0.0%
* Total # heads: Approximately 15
* **Layer \[16, 24):**
* Dark Green: 75.0%
* Green: 12.5%
* Orange: 6.2%
* Red: 6.2%
* Total # heads: Approximately 15
* **Layer \[24, 32):**
* Dark Green: 83.3%
* Green: 5.6%
* Orange: 11.1%
* Red: 0.0%
* Total # heads: Approximately 15
### Key Observations
* The distribution of "# heads" changes significantly across layers.
* Layer \[0, 8) has a relatively even distribution across the dark green, green, and orange segments.
* Layer \[16, 24) is dominated by the dark green segment (75.0%).
* Layer \[24, 32) also has a strong dominance of the dark green segment (83.3%).
* The red segment is only present in layers \[16, 24) and \[24, 32), and its contribution is relatively small (6.2% and 0.0% respectively).
### Interpretation
The chart suggests that the distribution of "heads" (likely referring to attention heads in a transformer model) varies considerably across different layers of the Pythia 6.9B model. The increasing dominance of the dark green segment in the later layers (\[16, 24) and \[24, 32)) could indicate that a larger proportion of attention heads are focused on a specific aspect or feature of the input data in those layers. The absence of the red segment in the earlier layers suggests that the higher-level features or relationships captured by those heads are not yet prominent. The varying percentages within each layer likely reflect the different roles and functionalities of the attention heads at each stage of the model's processing. The data suggests a shift in attention focus as information propagates through the layers of the model. The total number of heads appears to be relatively consistent across layers, around 10-15.