## Bar Chart: Pythia 6.9B Layer Head Distribution
### Overview
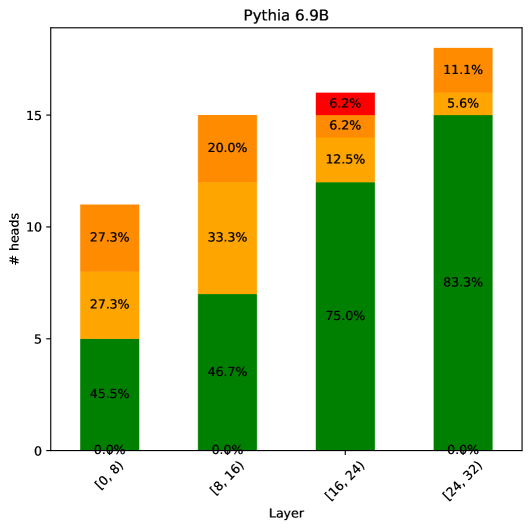
The chart visualizes the distribution of attention heads across four layers of the Pythia 6.9B model architecture. Each bar represents a layer range, with segmented colors indicating different head categories. The y-axis shows the total number of heads, while the x-axis categorizes layers into four ranges: [0,8), [8,16), [16,24), and [24,32).
### Components/Axes
- **X-axis (Layer Ranges)**:
- [0,8)
- [8,16)
- [16,24)
- [24,32)
- **Y-axis (# heads)**:
- Scale from 0 to 15 in increments of 5
- **Legend (Right-aligned)**:
- Green: 45.5% → 83.3% (dominant category)
- Orange: 27.3% → 5.6% (declining trend)
- Red: 6.2% (only in [16,24))
- Yellow: 27.3% → 11.1% (declining trend)
### Detailed Analysis
1. **Layer [0,8)**:
- Green: 45.5% (5 heads)
- Orange: 27.3% (3 heads)
- Yellow: 27.3% (3 heads)
- Red: 0.0%
2. **Layer [8,16)**:
- Green: 46.7% (7 heads)
- Orange: 33.3% (5 heads)
- Yellow: 20.0% (3 heads)
- Red: 0.0%
3. **Layer [16,24)**:
- Green: 75.0% (12 heads)
- Orange: 12.5% (2 heads)
- Red: 6.2% (1 head)
- Yellow: 6.2% (1 head)
4. **Layer [24,32)**:
- Green: 83.3% (13 heads)
- Orange: 5.6% (1 head)
- Yellow: 11.1% (2 heads)
- Red: 0.0%
### Key Observations
- **Green Dominance**: Green segments (likely "query" or "key" heads) increase monotonically from 45.5% to 83.3% across layers.
- **Orange Decline**: Orange segments (possibly "value" heads) decrease from 27.3% to 5.6%, suggesting reduced importance in deeper layers.
- **Red Anomaly**: Red appears only in the [16,24) layer at 6.2%, potentially indicating a specialized head type in mid-layers.
- **Yellow Reduction**: Yellow segments (possibly "mixed" heads) decrease from 27.3% to 11.1%, showing diminishing prevalence in deeper layers.
### Interpretation
The chart reveals a clear architectural pattern where:
1. **Layer Depth Correlation**: Deeper layers ([24,32)) concentrate attention heads into fewer, more specialized categories (green dominance).
2. **Head Type Evolution**: The decline of orange and yellow heads suggests a shift from general-purpose to query-dominated attention mechanisms in deeper layers.
3. **Mid-Layer Specialization**: The presence of red heads in [16,24) implies a unique architectural feature (e.g., gating or cross-attention) in mid-layers.
4. **Quantitative Precision**: The exact percentage values (e.g., 83.3% in [24,32)) indicate careful balancing of head types to optimize model performance.
This distribution pattern aligns with transformer architecture principles, where deeper layers typically develop more specialized attention mechanisms while maintaining computational efficiency through reduced head diversity.