\n
## Contour Plot: Dimensionality Reduction of Text Data
### Overview
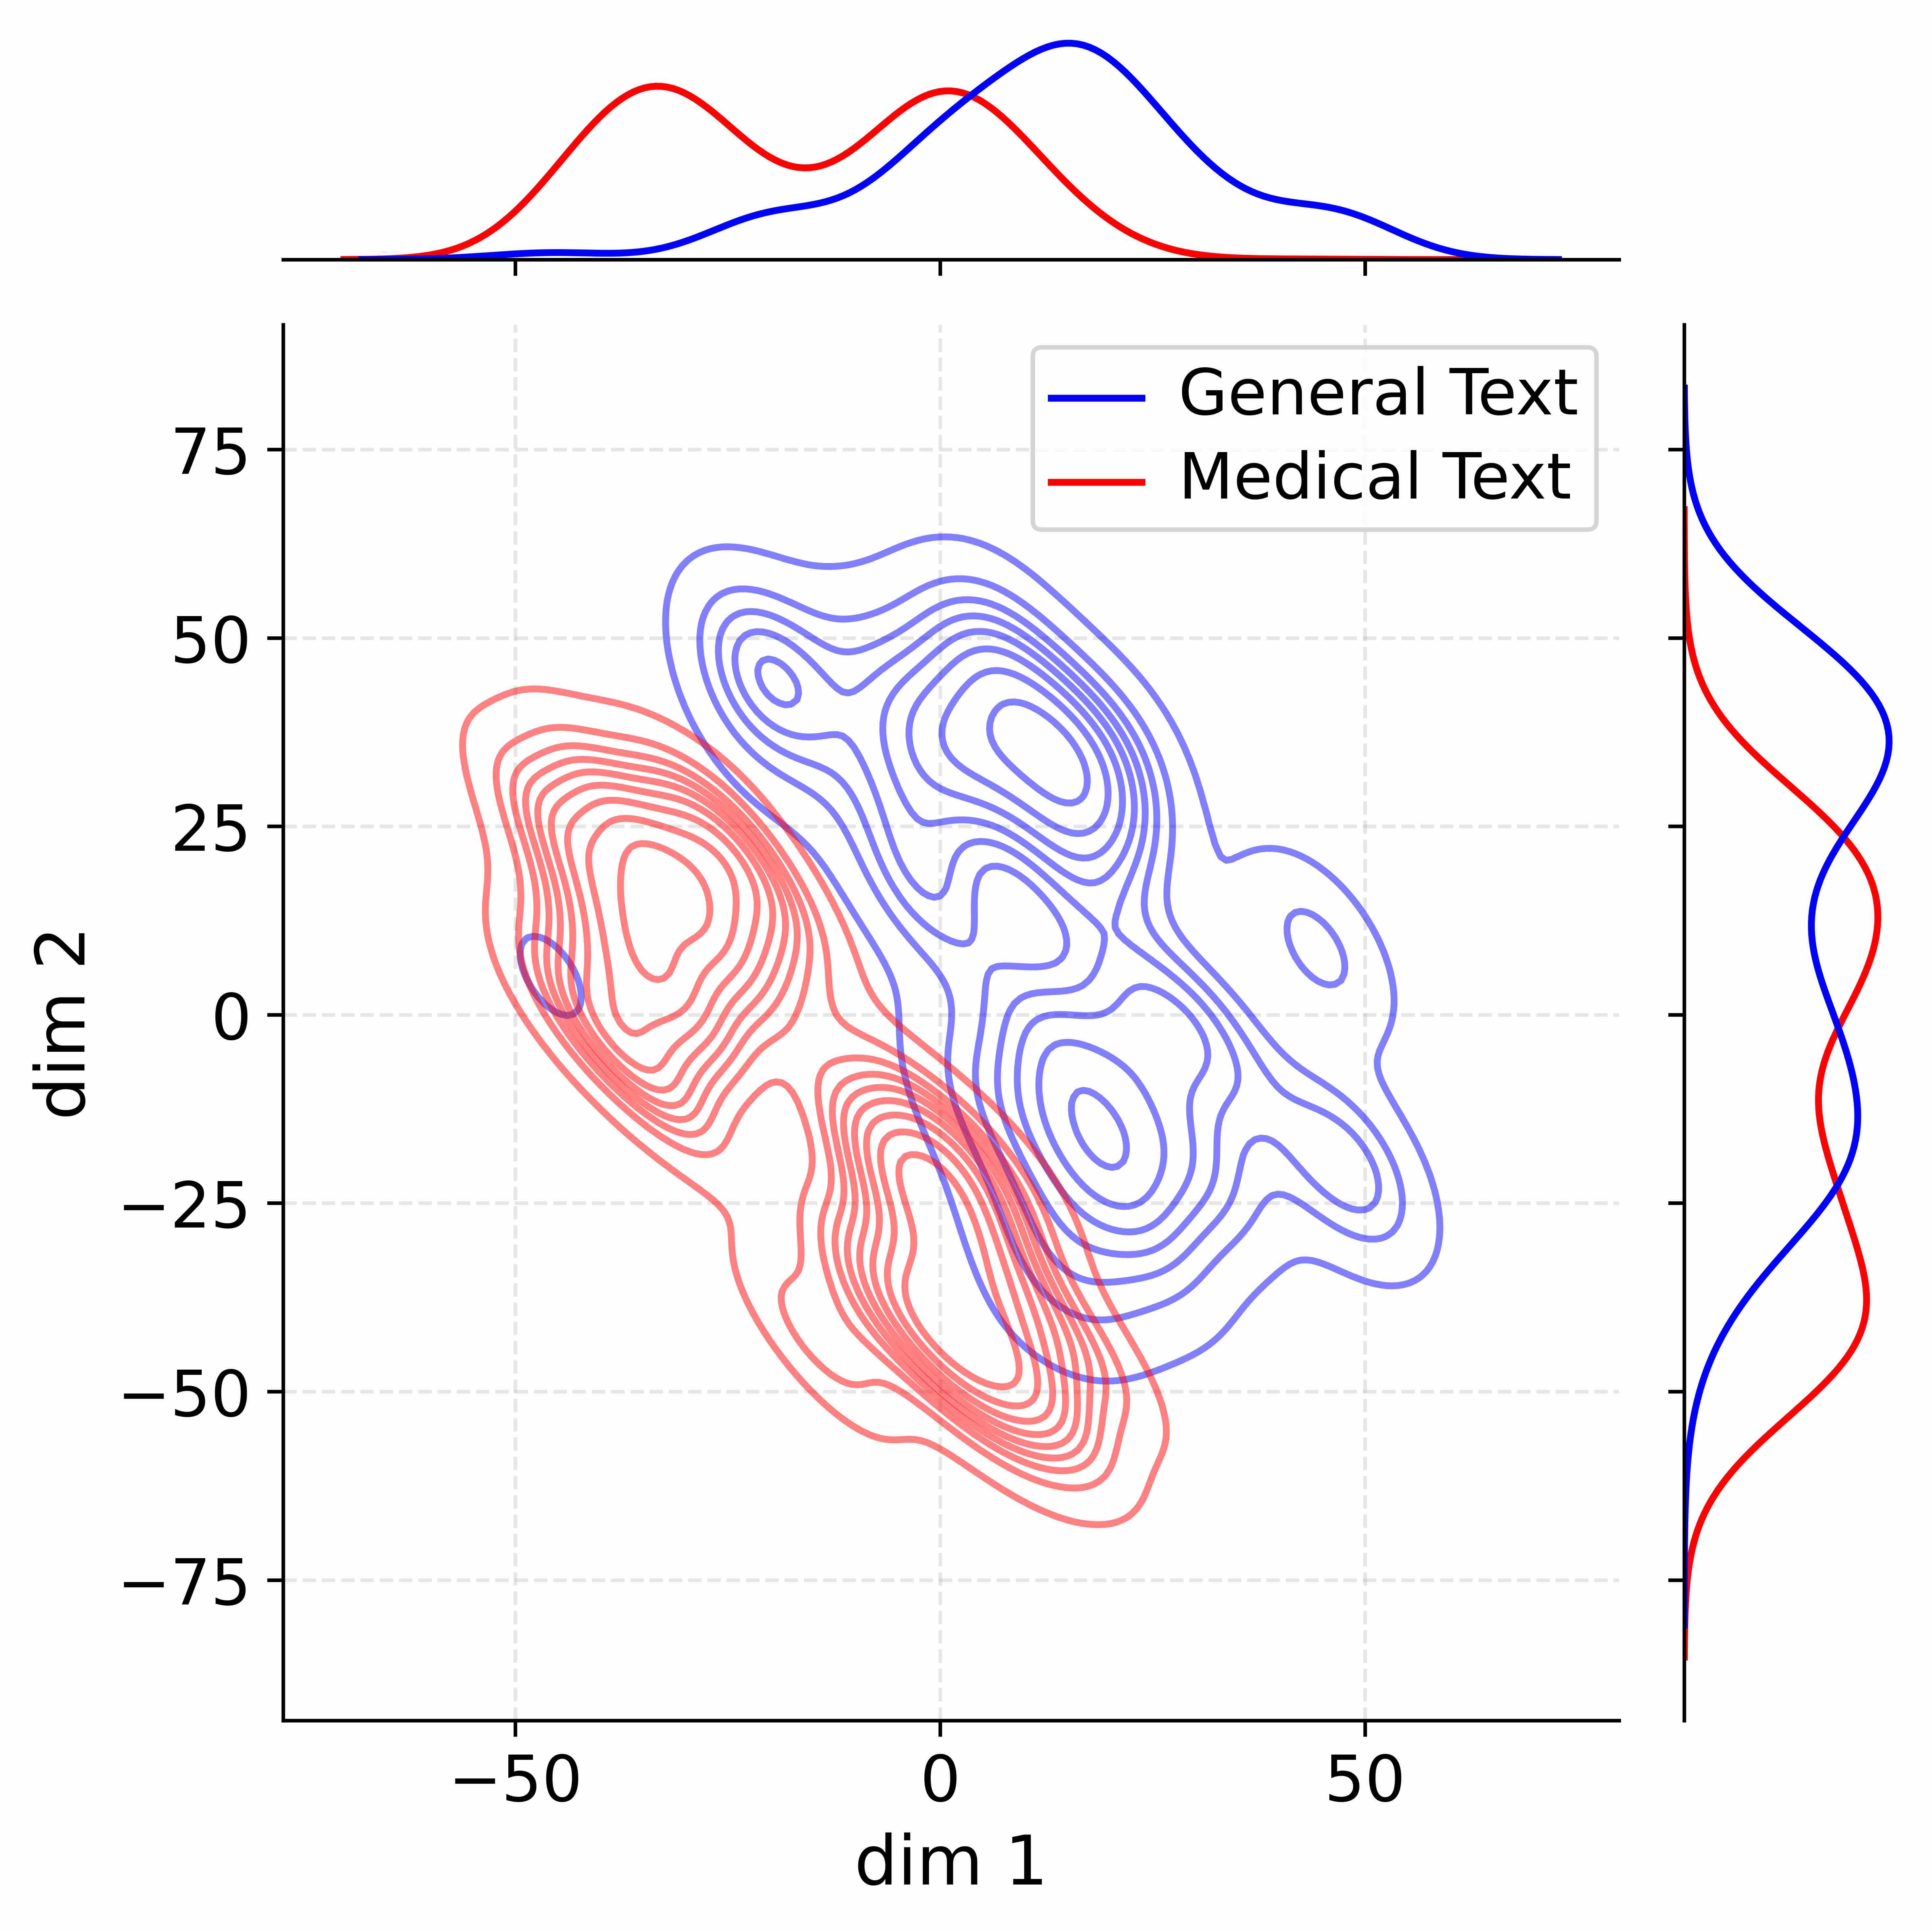
The image presents a 2D contour plot visualizing the distribution of two text categories – "General Text" and "Medical Text" – projected onto a space defined by two dimensions, "dim 1" and "dim 2". Above the contour plot are density plots representing the marginal distributions along each dimension for each text type. The plot appears to be the result of a dimensionality reduction technique (e.g., PCA, t-SNE, UMAP) applied to text data, aiming to separate the two categories based on their underlying features.
### Components/Axes
* **X-axis:** Labeled "dim 1", ranging approximately from -60 to 60.
* **Y-axis:** Labeled "dim 2", ranging approximately from -80 to 80.
* **Contour Lines:** Represent density levels of the data distribution. Darker lines indicate higher density.
* **Legend (Top-Right):**
* Blue line: "General Text"
* Red line: "Medical Text"
* **Density Plots (Top):**
* Blue curve: Density of "General Text" along the combined dimensions.
* Red curve: Density of "Medical Text" along the combined dimensions.
### Detailed Analysis
The contour plot shows overlapping distributions for "General Text" (blue contours) and "Medical Text" (red contours). However, there's a noticeable separation in the distributions.
* **General Text (Blue):** The highest density region for general text is centered around (dim1 ≈ 0, dim2 ≈ 25). The distribution extends towards negative dim1 values and positive dim2 values. The density plot shows a unimodal distribution, peaking around dim1 = 25.
* **Medical Text (Red):** The highest density region for medical text is centered around (dim1 ≈ -25, dim2 ≈ -25). The distribution extends towards negative dim1 and dim2 values. The density plot shows a unimodal distribution, peaking around dim1 = -25.
The density plots show that "General Text" tends to have higher values on dim1, while "Medical Text" tends to have lower values on dim1. Both distributions are roughly symmetrical.
### Key Observations
* **Overlap:** The distributions are not fully separated, indicating some ambiguity in classifying text based on these two dimensions.
* **Separation:** There is a clear trend of separation, with "General Text" clustering towards the right and upper-right quadrants, and "Medical Text" clustering towards the left and lower-left quadrants.
* **Density:** The density of "Medical Text" appears to be higher overall than "General Text" within the plotted region.
* **Symmetry:** Both distributions appear roughly symmetrical around their respective centers.
### Interpretation
This plot suggests that the dimensionality reduction technique has successfully captured some of the distinguishing characteristics of "General Text" and "Medical Text". The two dimensions, "dim 1" and "dim 2", represent latent features learned from the text data. The separation indicates that these features are correlated with the text category.
The overlap suggests that the distinction between the two text types is not always clear-cut, and some texts may exhibit characteristics of both. The higher density of "Medical Text" could indicate that the dataset contains more medical texts than general texts, or that medical texts are more tightly clustered in this feature space.
The density plots provide a marginal view of the distributions, confirming the trend observed in the contour plot: "General Text" tends to have higher values on dim1, while "Medical Text" tends to have lower values. This suggests that dim1 might represent a feature related to the complexity or specificity of the language used. Further investigation would be needed to determine the specific features that contribute to these dimensions.