## Scatter Plot with Contour Distributions: General Text vs Medical Text
### Overview
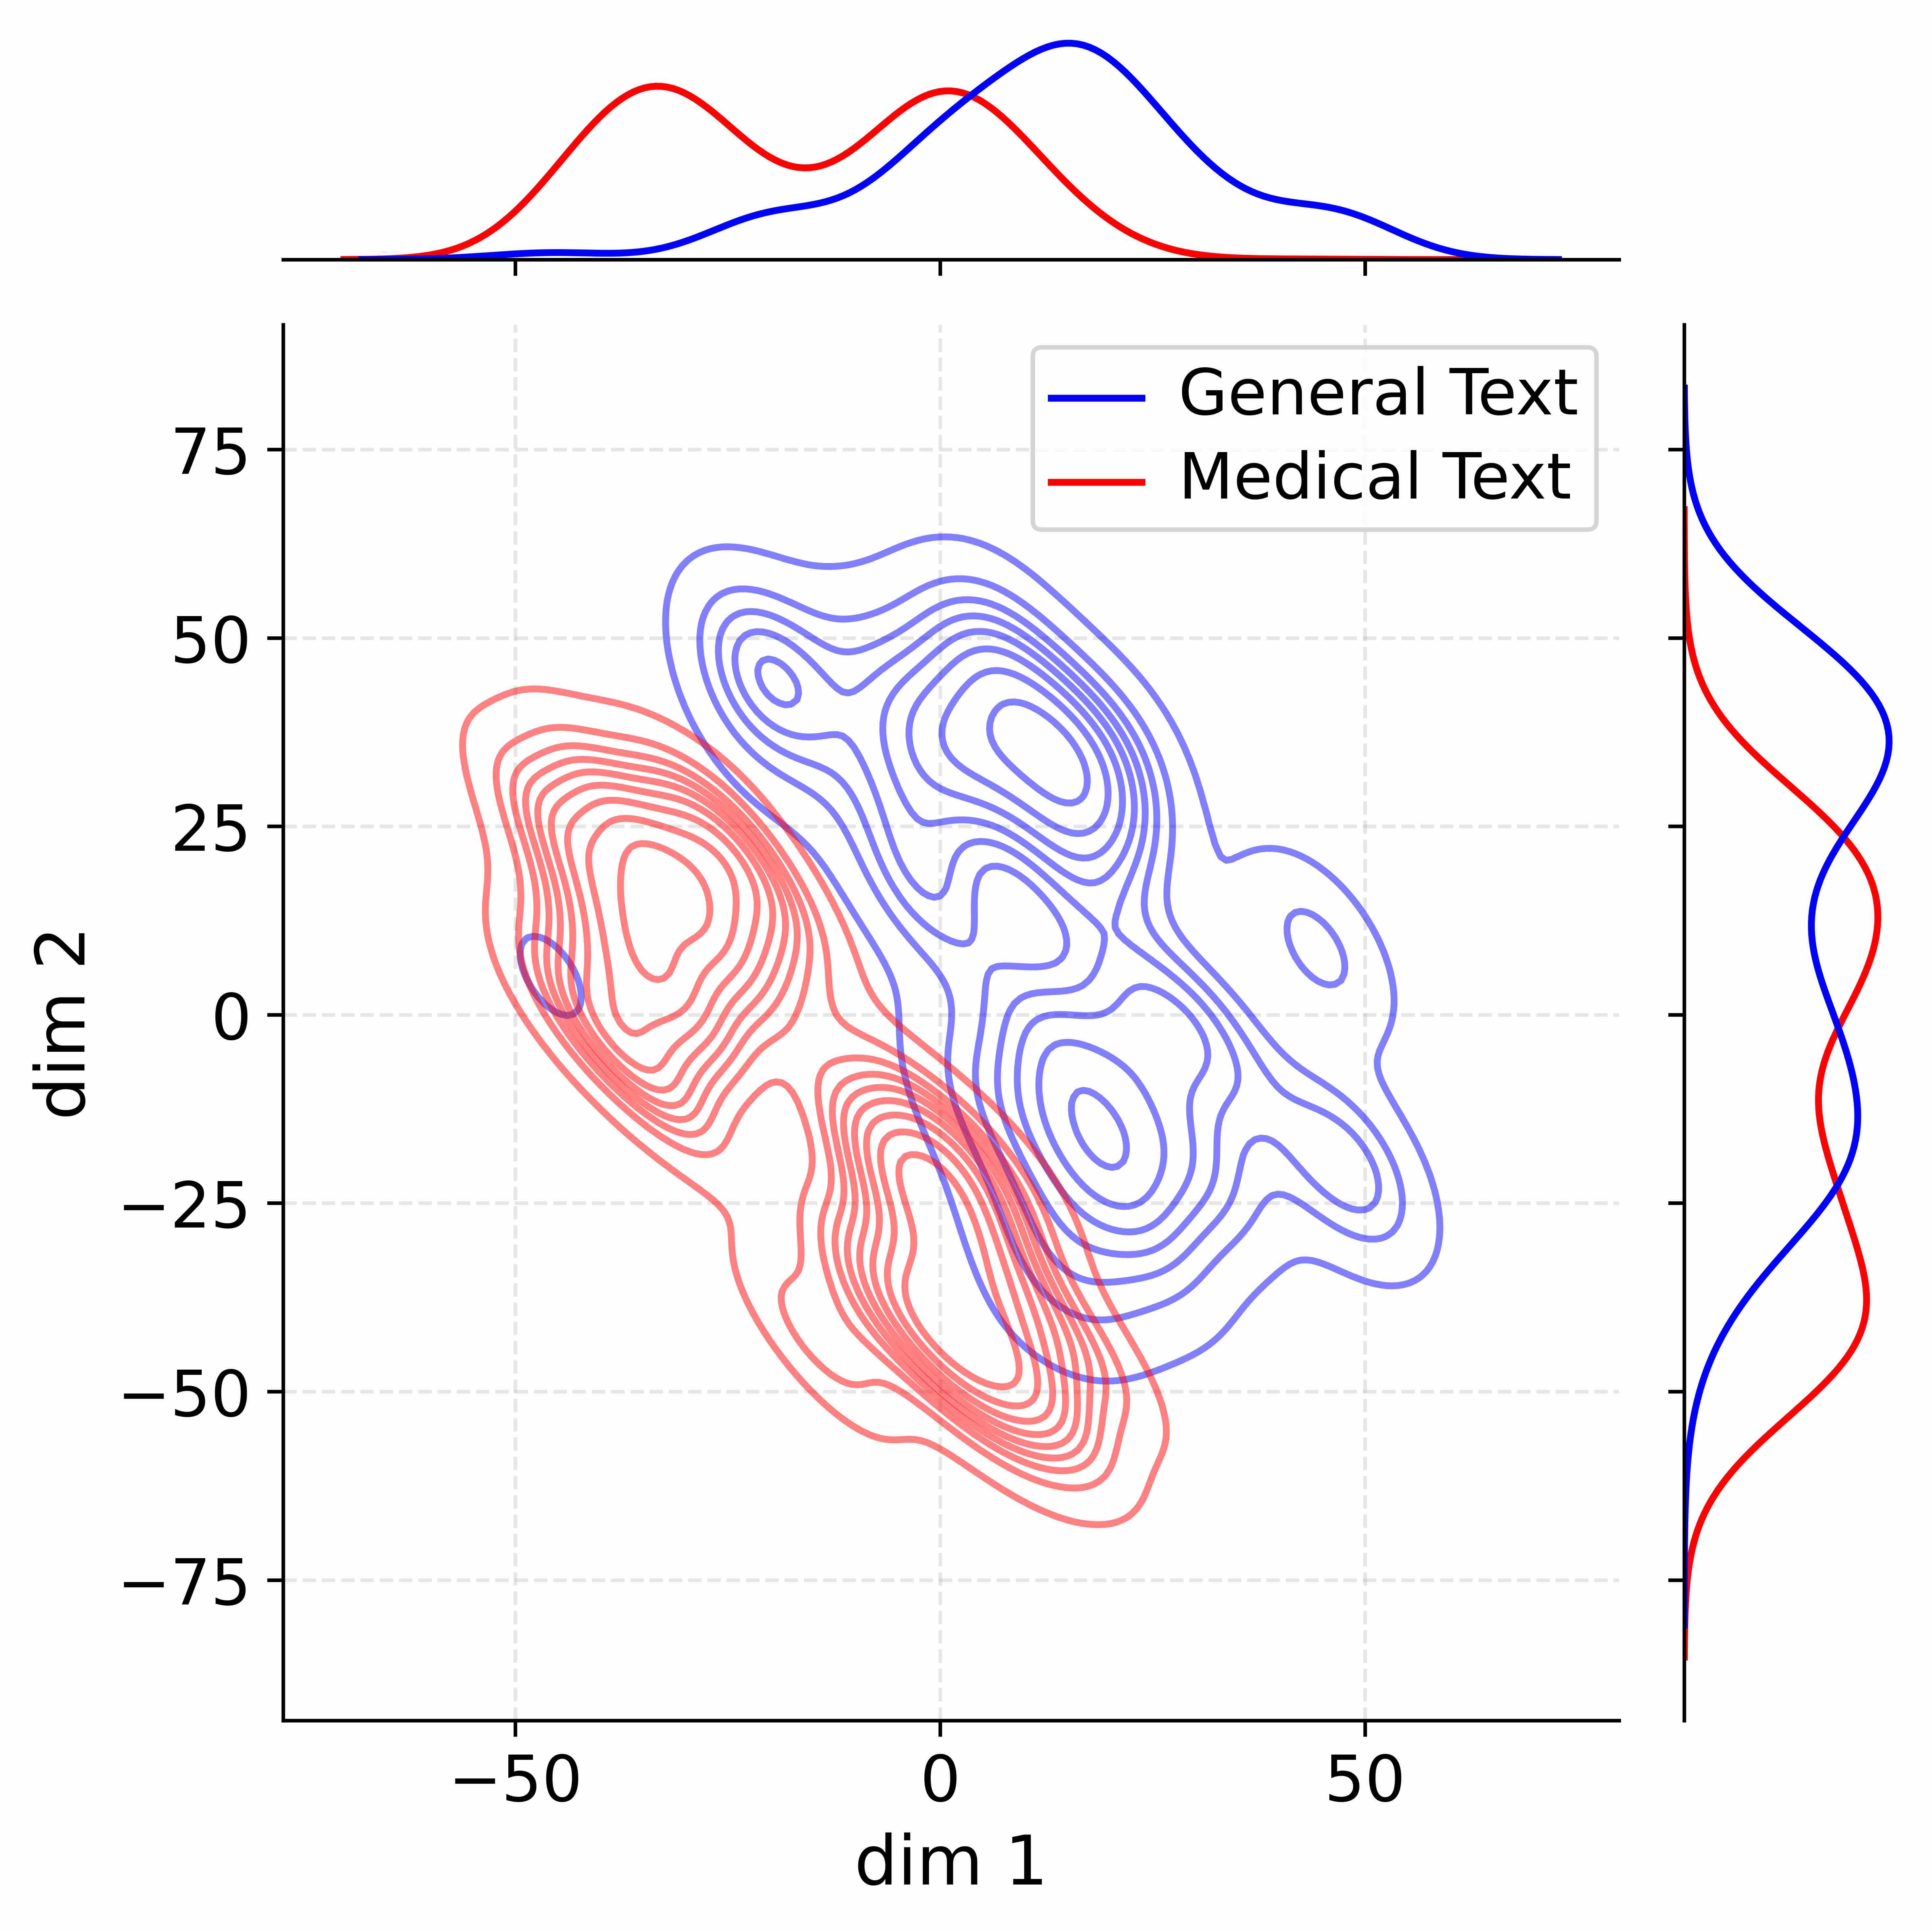
The image presents a 2D scatter plot comparing two text types (General Text and Medical Text) across two dimensions (dim1 and dim2). Contour lines represent density distributions, with marginal histograms showing univariate distributions. The plot reveals distinct but overlapping patterns between the two text types.
### Components/Axes
- **X-axis (dim1)**: Ranges from -50 to 50
- **Y-axis (dim2)**: Ranges from -75 to 75
- **Legend**:
- Blue = General Text
- Red = Medical Text
- **Marginal Histograms**:
- Top histogram: dim1 distribution
- Right histogram: dim2 distribution
### Detailed Analysis
1. **Contour Distributions**:
- **General Text (Blue)**:
- Centered around (dim1=0, dim2=0)
- Spreads to dim1=50 and dim2=75
- Density decreases radially outward
- **Medical Text (Red)**:
- Centered around (dim1=-50, dim2=-25)
- Extends to dim1=0 and dim2=25
- Density shows a secondary peak near (dim1=-25, dim2=-10)
2. **Marginal Histograms**:
- **dim1**:
- General Text peak at ~25
- Medical Text peak at ~-35
- Overlap between -10 and 10
- **dim2**:
- General Text peak at ~30
- Medical Text peak at ~-20
- Overlap between -10 and 10
### Key Observations
1. **Separation with Overlap**:
- Clear separation in dim1 (-35 vs +25)
- Partial overlap in dim2 (-20 vs +30)
- Significant overlap in the central region (-10 to +10 for both dimensions)
2. **Density Patterns**:
- General Text shows broader distribution in dim2
- Medical Text has a more concentrated distribution in dim1
- Secondary peak in Medical Text suggests bimodal distribution
### Interpretation
The data demonstrates that General Text and Medical Text occupy distinct but overlapping regions in the 2D space. The marginal histograms confirm this separation in dim1 (strong separation) and dim2 (moderate separation). The contour overlap in the central region (-10 to +10 for both dimensions) suggests:
1. **Ambiguity Zone**: Texts with mixed characteristics exist
2. **Feature Correlation**: dim1 and dim2 may represent related linguistic features
3. **Classification Potential**: While separable, the overlap indicates challenges in perfect classification
The marginal histograms provide critical context - the dim1 separation is more pronounced than dim2, suggesting dim1 might be a more discriminative feature. The secondary peak in Medical Text's dim1 distribution (-25) could indicate a subgroup with distinct characteristics.