## Bar Charts: Performance and Tool Calls Comparison
### Overview
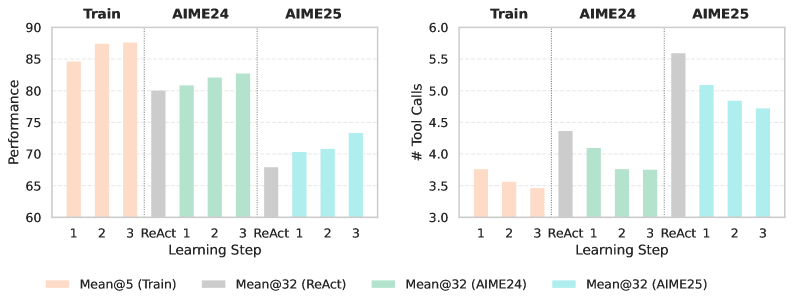
The image contains two bar charts side-by-side. The left chart displays "Performance" on the y-axis versus "Learning Step" on the x-axis for different training methods: "Train", "AIME24", and "AIME25". The right chart shows "# Tool Calls" on the y-axis versus "Learning Step" on the x-axis, again for the same training methods. The charts compare the performance and tool call counts across different learning steps and training configurations.
### Components/Axes
**Left Chart:**
* **Title:** "Train AIME24 AIME25" (appears to be a grouping label for the data)
* **Y-axis:** "Performance", with a scale from 60 to 90 in increments of 5.
* **X-axis:** "Learning Step", with categories "1", "2", "3", and "ReAct" for each training method.
* **Legend (bottom):**
* Peach: "Mean@5 (Train)"
* Gray: "Mean@32 (ReAct)"
* Green: "Mean@32 (AIME24)"
* Light Blue: "Mean@32 (AIME25)"
**Right Chart:**
* **Title:** "Train AIME24 AIME25" (appears to be a grouping label for the data)
* **Y-axis:** "# Tool Calls", with a scale from 3.0 to 6.0 in increments of 0.5.
* **X-axis:** "Learning Step", with categories "1", "2", "3", and "ReAct" for each training method.
* **Legend (bottom):** Same as the left chart.
### Detailed Analysis
**Left Chart (Performance):**
* **Mean@5 (Train) - Peach:**
* Step 1: Approximately 84.5
* Step 2: Approximately 87.5
* Step 3: Approximately 87.5
* Trend: Performance increases from step 1 to steps 2 and 3, then plateaus.
* **Mean@32 (ReAct) - Gray:**
* ReAct: Approximately 80
* Trend: Single data point.
* **Mean@32 (AIME24) - Green:**
* Step 1: Approximately 81
* Step 2: Approximately 82
* Step 3: Approximately 83
* Trend: Performance increases slightly across the steps.
* **Mean@32 (AIME25) - Light Blue:**
* Step 1: Approximately 71
* Step 2: Approximately 70
* Step 3: Approximately 71
* Trend: Relatively stable performance across the steps.
**Right Chart (# Tool Calls):**
* **Mean@5 (Train) - Peach:**
* Step 1: Approximately 3.75
* Step 2: Approximately 3.5
* Step 3: Approximately 3.4
* Trend: Number of tool calls decreases slightly across the steps.
* **Mean@32 (ReAct) - Gray:**
* ReAct: Approximately 4.4
* Trend: Single data point.
* **Mean@32 (AIME24) - Green:**
* Step 1: Approximately 4.1
* Step 2: Approximately 3.9
* Step 3: Approximately 3.8
* Trend: Number of tool calls decreases slightly across the steps.
* **Mean@32 (AIME25) - Light Blue:**
* Step 1: Approximately 5.1
* Step 2: Approximately 4.9
* Step 3: Approximately 4.8
* Trend: Number of tool calls decreases slightly across the steps.
### Key Observations
* The "Train" method (Mean@5) shows the highest performance but the lowest number of tool calls.
* The "ReAct" method (Mean@32) has a single data point for each chart, making trend analysis impossible.
* The "AIME24" method (Mean@32) shows a slight increase in performance and a slight decrease in tool calls across the learning steps.
* The "AIME25" method (Mean@32) shows relatively stable performance and a slight decrease in tool calls across the learning steps.
* AIME25 has the highest number of tool calls.
### Interpretation
The charts compare the performance and tool call efficiency of different training methods. The "Train" method appears to be the most performant, achieving high scores with fewer tool calls. The "ReAct" method's single data point prevents a thorough comparison. The "AIME24" and "AIME25" methods show different trade-offs between performance and tool call usage. AIME25 has the worst performance, but the highest number of tool calls. The data suggests that optimizing the training method can lead to better performance with fewer resources (tool calls). The "Mean@5" and "Mean@32" likely refer to different model configurations or averaging strategies, but without further context, their specific meaning is unclear.