\n
## Bar Charts: Performance and Tool Calls vs. Learning Step
### Overview
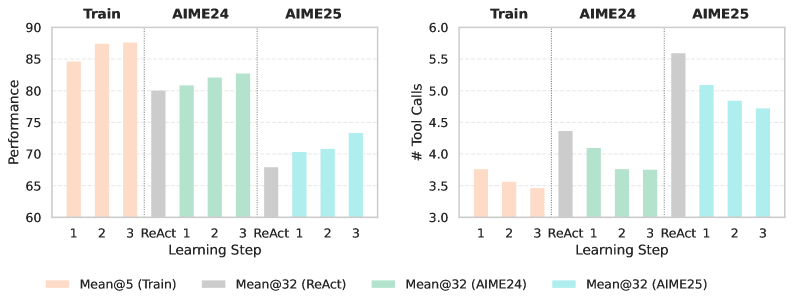
The image presents two sets of bar charts, side-by-side. The left chart displays "Performance" metrics, while the right chart shows the "# Tool Calls". Both charts compare performance across different "Learning Steps" (1, 2, 3, and ReAct) and for different models: "Train", "AIME24", and "AIME25". The charts use different colors to represent each model's performance.
### Components/Axes
* **X-axis (Both Charts):** "Learning Step" with categories: 1, 2, 3, ReAct.
* **Y-axis (Left Chart):** "Performance" ranging from approximately 60 to 90.
* **Y-axis (Right Chart):** "# Tool Calls" ranging from approximately 3.0 to 6.0.
* **Legend (Bottom):**
* Peach: "Mean@5 (Train)"
* Gray: "Mean@32 (ReAct)"
* Light Green: "Mean@32 (AIME24)"
* Light Blue: "Mean@32 (AIME25)"
* **Titles (Top):** "Train", "AIME24", "AIME25" are placed above each set of bars, indicating the model being evaluated.
### Detailed Analysis or Content Details
**Left Chart (Performance):**
* **Train (Peach):**
* Step 1: Approximately 84.
* Step 2: Approximately 88.
* Step 3: Approximately 87.
* **ReAct (Gray):**
* Step 1: Approximately 79.
* Step 2: Approximately 72.
* Step 3: Approximately 68.
* **AIME24 (Light Green):**
* Step 1: Approximately 79.
* Step 2: Approximately 82.
* Step 3: Approximately 84.
* **AIME25 (Light Blue):**
* Step 1: Approximately 72.
* Step 2: Approximately 75.
* Step 3: Approximately 70.
**Right Chart (# Tool Calls):**
* **Train (Peach):**
* Step 1: Approximately 3.3.
* Step 2: Approximately 3.6.
* Step 3: Approximately 3.5.
* **ReAct (Gray):**
* Step 1: Approximately 4.2.
* Step 2: Approximately 5.7.
* Step 3: Approximately 4.0.
* **AIME24 (Light Green):**
* Step 1: Approximately 4.5.
* Step 2: Approximately 4.8.
* Step 3: Approximately 4.7.
* **AIME25 (Light Blue):**
* Step 1: Approximately 4.8.
* Step 2: Approximately 5.1.
* Step 3: Approximately 5.0.
### Key Observations
* **Performance Trend:** For the "Train" model, performance increases from Step 1 to Step 2, then slightly decreases at Step 3. "ReAct" shows a consistent decline in performance across all steps. "AIME24" shows a steady increase in performance. "AIME25" shows a slight increase from Step 1 to Step 2, then a decrease at Step 3.
* **Tool Call Trend:** The number of tool calls generally increases from Step 1 to Step 2, and then plateaus or slightly decreases at Step 3 for all models.
* **ReAct Outlier:** The "ReAct" model consistently exhibits the lowest performance and a relatively high number of tool calls.
* **Train vs. AIME Models:** The "Train" model generally achieves the highest performance, while the "AIME" models show lower, but relatively stable, performance.
### Interpretation
The data suggests that increasing the "Learning Step" does not necessarily lead to improved performance, particularly for the "ReAct" model. The "Train" model demonstrates the best performance, but its gains diminish after Step 2. The "AIME" models show a more consistent, though lower, level of performance. The higher number of tool calls associated with the "ReAct" model, coupled with its declining performance, may indicate that the model is struggling to effectively utilize the tools available to it. The relationship between tool calls and performance is not straightforward; more tool calls do not automatically translate to better performance. The data could be used to inform decisions about which learning steps and models to prioritize for further development. The "ReAct" model may require further investigation to understand why it is underperforming. The consistent performance of the AIME models suggests they may be more robust to changes in the learning step.