## Bar Charts: Performance and Tool Calls Across Learning Steps
### Overview
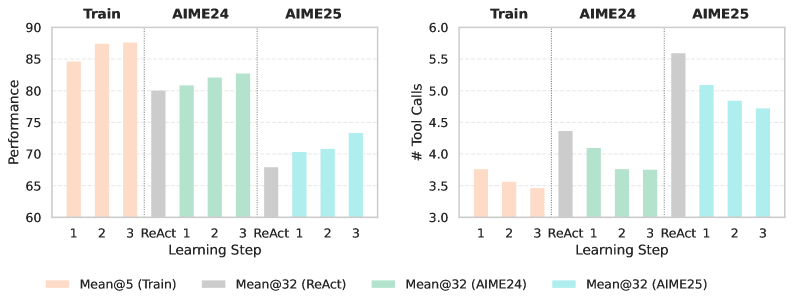
The image contains two side-by-side bar charts comparing the performance and tool usage of different methods across three datasets (Train, AIME24, AIME25) over a series of learning steps. The charts share a common legend and x-axis structure.
### Components/Axes
* **Chart Type:** Grouped Bar Charts.
* **Shared X-Axis:** Labeled "Learning Step". It is divided into three main categories: **Train**, **AIME24**, and **AIME25**. Within each category, there are four sub-categories representing different methods or steps: **1**, **2**, **3**, and **ReAct**.
* **Left Chart Y-Axis:** Labeled "Performance". Scale ranges from 60 to 90 in increments of 5.
* **Right Chart Y-Axis:** Labeled "# Tool Calls". Scale ranges from 3.0 to 6.0 in increments of 0.5.
* **Legend (Bottom Center):** Defines the color coding for the bars:
* **Peach/Light Orange:** Mean@5 (Train)
* **Gray:** Mean@32 (ReAct)
* **Light Green:** Mean@32 (AIME24)
* **Light Cyan/Blue:** Mean@32 (AIME25)
### Detailed Analysis
#### Left Chart: Performance
* **Trend Verification:** The "Performance" metric generally shows an upward trend with increasing learning steps (1 -> 2 -> 3) within each dataset category, with the exception of the "ReAct" method which is consistently lower than step 3.
* **Data Points (Approximate Values):**
* **Train Category (Peach Bars):**
* Step 1: ~84.5
* Step 2: ~87.5
* Step 3: ~88.0
* **AIME24 Category (Green Bars):**
* ReAct: ~80.0
* Step 1: ~81.0
* Step 2: ~82.5
* Step 3: ~83.0
* **AIME25 Category (Cyan Bars):**
* ReAct: ~68.0
* Step 1: ~70.5
* Step 2: ~71.0
* Step 3: ~73.5
#### Right Chart: # Tool Calls
* **Trend Verification:** The "# Tool Calls" metric shows a generally decreasing trend with increasing learning steps (1 -> 2 -> 3) within each dataset category. The "ReAct" method shows a distinct pattern, with a very high value for AIME25.
* **Data Points (Approximate Values):**
* **Train Category (Peach Bars):**
* Step 1: ~3.75
* Step 2: ~3.60
* Step 3: ~3.50
* **AIME24 Category (Green Bars):**
* ReAct: ~4.40
* Step 1: ~4.10
* Step 2: ~3.80
* Step 3: ~3.80
* **AIME25 Category (Cyan Bars):**
* ReAct: ~5.60
* Step 1: ~5.10
* Step 2: ~4.85
* Step 3: ~4.75
### Key Observations
1. **Performance vs. Efficiency Trade-off:** There is a clear inverse relationship between the two charts. As learning steps progress (1->2->3), performance increases while the number of tool calls decreases, suggesting improved efficiency.
2. **ReAct Baseline:** The "ReAct" method (gray bars) serves as a baseline. The numbered learning steps (1, 2, 3) consistently outperform ReAct in the Performance metric across AIME24 and AIME25, while also using fewer tool calls in AIME24 and AIME25 (except for AIME25 ReAct's very high tool call count).
3. **Dataset Difficulty:** Performance is highest on the "Train" dataset, lower on "AIME24", and lowest on "AIME25". Conversely, tool calls are lowest on "Train" and highest on "AIME25", indicating AIME25 is the most challenging dataset.
4. **AIME25 ReAct Anomaly:** The ReAct method on the AIME25 dataset shows a particularly high number of tool calls (~5.6) coupled with the lowest performance (~68.0), highlighting its inefficiency on this specific task.
### Interpretation
The data demonstrates the effectiveness of a sequential learning process (steps 1, 2, 3) over a static ReAct approach. The progressive improvement in performance alongside a reduction in tool calls suggests the system is learning to solve problems more accurately and efficiently with each step. The consistent pattern across two different evaluation datasets (AIME24 and AIME25) indicates the learning method is robust. The significant performance drop and tool call increase for ReAct on AIME25 imply that this dataset contains problems where the standard ReAct paradigm struggles, possibly requiring more complex reasoning or planning that the step-wise learning process better accommodates. The charts collectively argue for the value of iterative learning in improving both the effectiveness (performance) and efficiency (reduced tool use) of an AI system on complex reasoning tasks.