# Technical Document Extraction: Bar Chart Analysis
## Chart Structure and Components
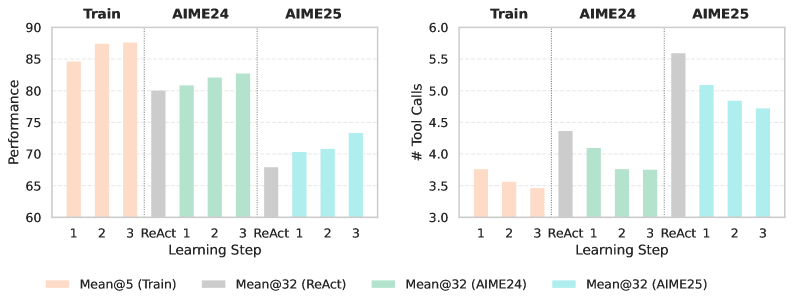
### Left Chart: Performance Metrics
- **Title**: Not explicitly labeled (assumed to be "Performance Metrics" based on context)
- **X-Axis**:
- Label: "Learning Step"
- Categories:
- 1, 2, 3 (Training Steps)
- ReAct 1, 2, 3 (ReAct Steps)
- **Y-Axis**:
- Label: "Performance"
- Range: 60 to 90
- **Legend**:
- Position: Bottom of the chart
- Entries:
- **Orange**: Mean@5 (Train)
- **Gray**: Mean@32 (ReAct)
- **Green**: Mean@32 (AIME24)
- **Blue**: Mean@32 (AIME25)
### Right Chart: Tool Call Frequency
- **Title**: Not explicitly labeled (assumed to be "Tool Call Frequency" based on context)
- **X-Axis**:
- Label: "Learning Step"
- Categories:
- 1, 2, 3 (Training Steps)
- ReAct 1, 2, 3 (ReAct Steps)
- **Y-Axis**:
- Label: "# Tool Calls"
- Range: 3 to 6
- **Legend**:
- Position: Bottom of the chart
- Entries:
- **Orange**: Mean@5 (Train)
- **Gray**: Mean@32 (ReAct)
- **Green**: Mean@32 (AIME24)
- **Blue**: Mean@32 (AIME25)
## Data Extraction and Trends
### Left Chart: Performance Metrics
#### Key Trends:
1. **Train (Orange)**:
- **Trend**: Starts high (85–88) in Training Steps 1–3, then drops sharply to ~70 in ReAct Steps.
- **Data Points**:
- Step 1: ~85
- Step 2: ~87
- Step 3: ~88
- ReAct 1: ~70
- ReAct 2: ~80
- ReAct 3: ~82
2. **ReAct (Gray)**:
- **Trend**: Starts lower than Train but increases slightly across ReAct Steps.
- **Data Points**:
- ReAct 1: ~70
- ReAct 2: ~80
- ReAct 3: ~82
3. **AIME24 (Green)**:
- **Trend**: Gradual increase from ~80 (ReAct 1) to ~83 (ReAct 3).
- **Data Points**:
- ReAct 1: ~80
- ReAct 2: ~82
- ReAct 3: ~83
4. **AIME25 (Blue)**:
- **Trend**: Starts lower than AIME24 but rises steadily.
- **Data Points**:
- ReAct 1: ~70
- ReAct 2: ~71
- ReAct 3: ~73
### Right Chart: Tool Call Frequency
#### Key Trends:
1. **Train (Orange)**:
- **Trend**: Decreases sharply from ~3.5 (Step 1) to ~3.2 (Step 3).
- **Data Points**:
- Step 1: ~3.5
- Step 2: ~3.3
- Step 3: ~3.2
2. **ReAct (Gray)**:
- **Trend**: Increases significantly from ~4.3 (ReAct 1) to ~5.6 (ReAct 3).
- **Data Points**:
- ReAct 1: ~4.3
- ReAct 2: ~4.1
- ReAct 3: ~5.6
3. **AIME24 (Green)**:
- **Trend**: Fluctuates slightly but remains relatively stable.
- **Data Points**:
- ReAct 1: ~3.8
- ReAct 2: ~3.7
- ReAct 3: ~3.6
4. **AIME25 (Blue)**:
- **Trend**: Peaks at ReAct 1 (~4.5) then declines.
- **Data Points**:
- ReAct 1: ~4.5
- ReAct 2: ~4.3
- ReAct 3: ~4.2
## Spatial Grounding and Color Verification
- **Legend Position**: Bottom of both charts.
- **Color Consistency**:
- **Orange** (Train) matches all orange bars in both charts.
- **Gray** (ReAct) matches all gray bars in both charts.
- **Green** (AIME24) matches all green bars in both charts.
- **Blue** (AIME25) matches all blue bars in both charts.
## Component Isolation
- **Left Chart**: Focuses on performance metrics (y-axis: 60–90).
- **Right Chart**: Focuses on tool call frequency (y-axis: 3–6).
- **Shared Elements**:
- X-axis labels ("Learning Step").
- Legend structure (four categories with distinct colors).
## Conclusion
The charts compare performance and tool call frequency across training and ReAct steps for different models (Train, ReAct, AIME24, AIME25). Key observations include:
- Train models show high initial performance but decline during ReAct steps.
- ReAct steps improve performance for AIME24 and AIME25.
- Tool call frequency decreases for Train models but increases for ReAct models, with AIME25 showing the highest peak.