## Scatter Plot Grid: RSA ERM Performance
### Overview
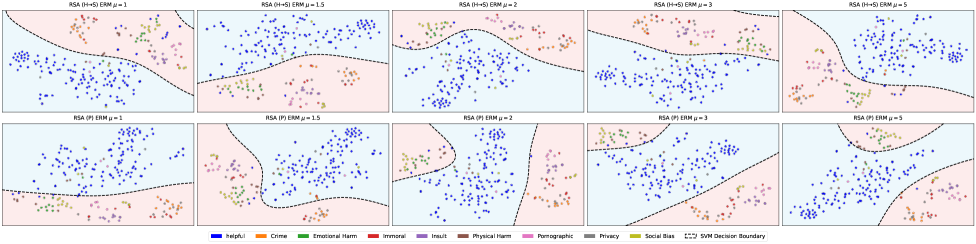
The image presents a grid of scatter plots, each visualizing the performance of Risk Sensitive Algorithm (RSA) with Empirical Risk Minimization (ERM) under different conditions. The plots are arranged in a 2x5 grid, with the top row representing RSA using (H+S) and the bottom row representing RSA using (P). The columns represent different values of the parameter μ (1, 1.5, 2, 3, 5). Each scatter plot displays data points categorized into different classes, separated by an SVM decision boundary.
### Components/Axes
* **Titles:** Each plot has a title in the format "RSA (H+S) ERM μ = [value]" or "RSA (P) ERM μ = [value]", where [value] is 1, 1.5, 2, 3, or 5.
* **Data Points:** Data points are colored according to their class.
* **Decision Boundary:** A dashed black line represents the SVM decision boundary.
* **Background:** The background is colored to indicate the region classified by the SVM. Light blue and light red/pink are used.
* **Legend:** Located at the bottom of the image, the legend maps colors to classes:
* Blue: Helpful
* Orange: Crime
* Green: Emotional Harm
* Red: Immoral
* Purple: Insult
* Pink: Physical Harm
* Brown: Pornographic
* Gray: Privacy
* Yellow: Social Bias
* Black Dashed Line: SVM Decision Boundary
### Detailed Analysis
**Top Row: RSA (H+S) ERM**
* **RSA (H+S) ERM μ = 1:** Data points are relatively well-separated. The decision boundary is curved.
* **RSA (H+S) ERM μ = 1.5:** The decision boundary becomes more complex.
* **RSA (H+S) ERM μ = 2:** The decision boundary continues to adjust.
* **RSA (H+S) ERM μ = 3:** The decision boundary continues to adjust.
* **RSA (H+S) ERM μ = 5:** The decision boundary continues to adjust.
**Bottom Row: RSA (P) ERM**
* **RSA (P) ERM μ = 1:** Data points are relatively well-separated. The decision boundary is curved.
* **RSA (P) ERM μ = 1.5:** The decision boundary becomes more complex.
* **RSA (P) ERM μ = 2:** The decision boundary continues to adjust.
* **RSA (P) ERM μ = 3:** The decision boundary continues to adjust.
* **RSA (P) ERM μ = 5:** The decision boundary continues to adjust.
### Key Observations
* The decision boundaries change as the value of μ increases for both RSA (H+S) and RSA (P).
* The distribution of data points for each class appears consistent across all plots.
* The complexity of the decision boundary seems to increase with higher values of μ.
### Interpretation
The plots illustrate how the parameter μ affects the decision boundary learned by the RSA-ERM algorithm. As μ increases, the algorithm may be fitting the training data more closely, resulting in more complex decision boundaries. The difference between RSA (H+S) and RSA (P) is subtle, but there are some differences in the shape of the decision boundaries. The data suggests that the choice of μ can significantly impact the performance of the classifier.