\n
## Diagram: Stakeholder Interaction Model
### Overview
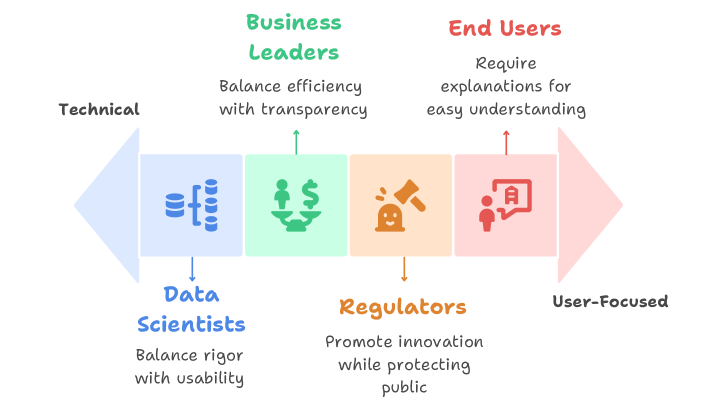
The image presents a diagram illustrating the interactions between four key stakeholder groups: Business Leaders, Data Scientists, Regulators, and End Users. The diagram uses a bidirectional arrow structure to represent the flow of information and influence between these groups, categorized along two axes: "Technical" vs. "User-Focused". Each stakeholder group is associated with a specific icon and a brief description of their primary concerns or needs.
### Components/Axes
* **Stakeholder Groups:** Business Leaders, Data Scientists, Regulators, End Users.
* **Axes:**
* Horizontal: "Technical" (left) to "User-Focused" (right).
* Vertical: Implied interaction/influence between groups.
* **Icons:**
* Data Scientists: A set of bars with equal signs.
* Business Leaders: A dollar sign.
* Regulators: A gavel.
* End Users: A speech bubble with a house icon inside.
* **Descriptions:**
* Business Leaders: "Balance efficiency with transparency"
* Data Scientists: "Balance rigor with usability"
* Regulators: "Promote innovation while protecting public"
* End Users: "Require explanations for easy understanding"
### Detailed Analysis / Content Details
The diagram is structured as a series of connected rectangles, each representing a stakeholder group. The rectangles are colored as follows:
* Data Scientists: Blue
* Business Leaders: Green
* Regulators: Orange
* End Users: Pink
Bidirectional arrows connect the rectangles, indicating a two-way relationship. The arrows are also colored:
* Data Scientists <-> Business Leaders: Green
* Business Leaders <-> End Users: Pink
* Data Scientists <-> Regulators: Orange
* Regulators <-> End Users: Pink
The "Technical" label is positioned at the left end of the horizontal axis, aligned with the Data Scientists rectangle. The "User-Focused" label is positioned at the right end of the horizontal axis, aligned with the End Users rectangle.
### Key Observations
The diagram highlights the interconnectedness of these four stakeholder groups. The placement of Data Scientists and Business Leaders on the "Technical" side and End Users on the "User-Focused" side suggests a natural division of concerns. Regulators are positioned centrally, implying a role in mediating between technical development and user needs. The bidirectional arrows emphasize that the relationship between each group is not one-way; each stakeholder influences and is influenced by the others.
### Interpretation
This diagram illustrates a model for considering diverse perspectives in a system or project. It suggests that successful outcomes require balancing technical rigor with user usability, efficiency with transparency, and innovation with public protection. The diagram is not presenting quantitative data, but rather a qualitative framework for understanding stakeholder relationships. The positioning of the stakeholders along the "Technical" to "User-Focused" axis suggests a spectrum of priorities, and the arrows indicate the need for ongoing communication and collaboration. The diagram implies that neglecting any one stakeholder group could lead to suboptimal results. The model is a simplification, but it provides a useful starting point for analyzing complex interactions and ensuring that all relevant perspectives are considered.