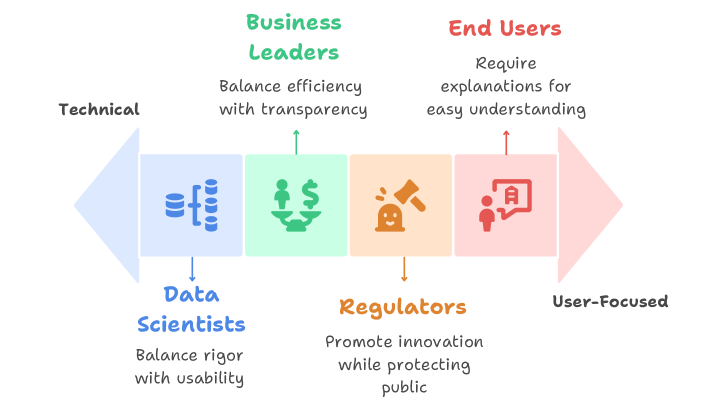
## Flowchart: Stakeholder Roles in AI/Data Projects
### Overview
The flowchart illustrates the interplay between four key stakeholders in AI/data projects: Data Scientists, Business Leaders, Regulators, and End Users. It emphasizes balancing technical rigor with usability, transparency, and ethical considerations.
### Components/Axes
- **Left-to-Right Flow**: Technical (Data Scientists) → Business Leaders → Regulators → User-Focused (End Users)
- **Icons**:
- Data Scientists: Stacked disks (data) + fork (code)
- Business Leaders: Scales (efficiency/transparency)
- Regulators: Shield (protection) + gavel (enforcement)
- End Users: Person with speech bubble (explanations)
- **Text Labels**:
- Technical → Business Leaders: "Balance efficiency with transparency"
- Business Leaders → Regulators: "Promote innovation while protecting public"
- Regulators → End Users: "Require explanations for easy understanding"
- Data Scientists: "Balance rigor with usability"
### Detailed Analysis
1. **Data Scientists** (Leftmost):
- Technical focus (data/code icons)
- Must balance "rigor" (accuracy) with "usability" (practical application)
- Positioned as the foundation of the workflow
2. **Business Leaders** (Center-Left):
- Represented by scales balancing efficiency and transparency
- Act as intermediaries between technical teams and regulatory/end-user needs
- Emphasize operational and strategic priorities
3. **Regulators** (Center-Right):
- Symbolized by shield (protection) and gavel (enforcement)
- Mandate innovation promotion while safeguarding public interests
- Positioned as gatekeepers of ethical compliance
4. **End Users** (Rightmost):
- Depicted as a person seeking explanations
- Require "easy understanding" of AI/data systems
- Final destination of the workflow, emphasizing user-centric design
### Key Observations
- **Directionality**: All arrows point rightward, suggesting a linear progression from technical development to user adoption.
- **Balancing Acts**: Each stakeholder has competing priorities (e.g., "rigor vs. usability," "efficiency vs. transparency").
- **Regulatory Role**: Regulators are positioned as both enablers ("promote innovation") and restrictors ("protecting public").
- **User-Centricity**: End Users are isolated on the far right, highlighting their unique need for explainability.
### Interpretation
This flowchart maps the ecosystem of AI/data projects, revealing:
1. **Technical-User Tension**: Data Scientists must translate complex models into user-friendly outputs, while End Users demand simplicity without sacrificing accuracy.
2. **Regulatory Sandwich**: Business Leaders operate between technical innovation and regulatory constraints, acting as translators for both sides.
3. **Ethical Imperative**: The shield/gavel icon for Regulators underscores the growing importance of ethical AI governance.
4. **Collaborative Framework**: The flowchart implies that successful AI projects require alignment across all four stakeholder groups, with no single role dominating the process.
The diagram suggests that modern AI development is a multidisciplinary effort requiring technical excellence, business acumen, regulatory compliance, and user empathy. The absence of feedback loops implies a linear but potentially oversimplified view of real-world implementation challenges.