## Line Graph: Accuracy vs. Compute (exaFLOP)
### Overview
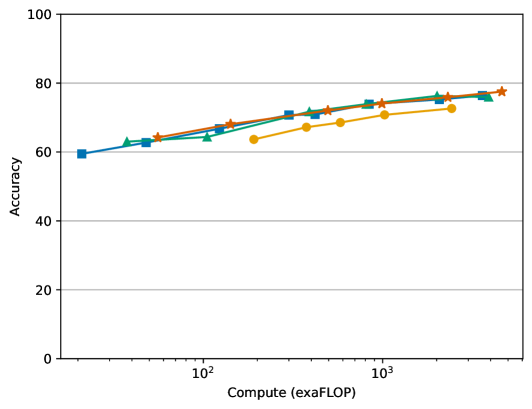
The image is a line graph comparing the accuracy of four models (A, B, C, D) across varying computational resources (exaFLOP). The x-axis represents compute (exaFLOP) on a logarithmic scale (10² to 10³), while the y-axis shows accuracy (0–100%). Four distinct lines with unique markers and colors represent each model, showing how accuracy improves with increased compute.
### Components/Axes
- **X-axis (Compute)**: Labeled "Compute (exaFLOP)" with a logarithmic scale (10² to 10³). Ticks are spaced logarithmically, with approximate values at 10², 10².5, and 10³.
- **Y-axis (Accuracy)**: Labeled "Accuracy" with a linear scale (0–100%).
- **Legend**: Located on the right side of the graph. Entries:
- **Model A**: Blue squares
- **Model B**: Red stars
- **Model C**: Green triangles
- **Model D**: Yellow circles
- **Lines**: Four continuous lines connect data points for each model, with markers at specific x-axis intervals.
### Detailed Analysis
- **Model A (Blue Squares)**:
- At 10² exaFLOP: ~60% accuracy.
- At 10³ exaFLOP: ~70% accuracy.
- Trend: Steady upward slope, moderate improvement.
- **Model B (Red Stars)**:
- At 10² exaFLOP: ~62% accuracy.
- At 10³ exaFLOP: ~75% accuracy.
- Trend: Slightly steeper slope than Model A, highest accuracy at 10³.
- **Model C (Green Triangles)**:
- At 10² exaFLOP: ~63% accuracy.
- At 10³ exaFLOP: ~76% accuracy.
- Trend: Similar to Model B but slightly lower final accuracy.
- **Model D (Yellow Circles)**:
- At 10² exaFLOP: ~61% accuracy.
- At 10³ exaFLOP: ~72% accuracy.
- Trend: Slowest improvement, lowest final accuracy.
### Key Observations
1. **Positive Correlation**: All models show increased accuracy with higher compute, confirming the general trend of computational efficiency improving performance.
2. **Model B Dominance**: Model B (red stars) achieves the highest accuracy (~75%) at 10³ exaFLOP, outperforming others.
3. **Model D Lag**: Model D (yellow circles) shows the smallest improvement (~11% gain) and lowest final accuracy (~72%).
4. **Logarithmic Scale Impact**: The x-axis compression emphasizes differences in performance gains at higher compute levels (e.g., 10³ exaFLOP).
### Interpretation
The data suggests that computational resources significantly impact model accuracy, but efficiency varies across models. Model B demonstrates the most effective scaling, achieving higher accuracy with relatively lower compute compared to others. Model D’s slower improvement highlights potential inefficiencies in its architecture or training. The logarithmic x-axis underscores that gains at higher compute levels (e.g., 10³ exaFLOP) are more pronounced, suggesting diminishing returns at lower compute ranges. This analysis could guide resource allocation for model training, prioritizing models with better compute-to-accuracy ratios.