\n
## Line Chart: Symbol Error Rate vs. Pilot Size for Different Algorithms
### Overview
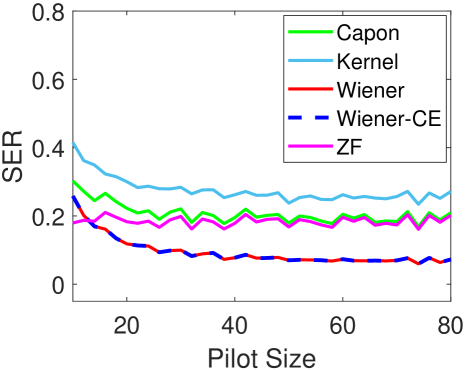
This image presents a line chart illustrating the relationship between Symbol Error Rate (SER) and Pilot Size for five different algorithms: Capon, Kernel, Wiener, Wiener-CE, and ZF. The chart aims to compare the performance of these algorithms in terms of SER as the pilot size increases.
### Components/Axes
* **X-axis:** Pilot Size, ranging from approximately 0 to 80. The axis is labeled "Pilot Size".
* **Y-axis:** Symbol Error Rate (SER), ranging from approximately 0 to 0.8. The axis is labeled "SER".
* **Legend:** Located in the top-right corner of the chart. It identifies the five algorithms using both labels and corresponding line colors:
* Capon (Green)
* Kernel (Light Blue)
* Wiener (Red)
* Wiener-CE (Dark Blue, dashed line)
* ZF (Magenta)
### Detailed Analysis
Here's a breakdown of each algorithm's trend and approximate data points, verified by color matching with the legend:
* **Capon (Green):** The line starts at approximately SER = 0.32 at Pilot Size = 0, then generally decreases to around SER = 0.24 at Pilot Size = 20, fluctuates between 0.24 and 0.30 until Pilot Size = 60, and then increases slightly to approximately SER = 0.31 at Pilot Size = 80.
* **Kernel (Light Blue):** The line begins at approximately SER = 0.35 at Pilot Size = 0, decreases to around SER = 0.28 at Pilot Size = 20, remains relatively stable between 0.26 and 0.32 until Pilot Size = 80.
* **Wiener (Red):** The line starts at approximately SER = 0.15 at Pilot Size = 0, decreases to around SER = 0.08 at Pilot Size = 20, and remains relatively stable between 0.07 and 0.12 until Pilot Size = 80.
* **Wiener-CE (Dark Blue, dashed):** The line begins at approximately SER = 0.25 at Pilot Size = 0, decreases to around SER = 0.18 at Pilot Size = 20, fluctuates between 0.16 and 0.22 until Pilot Size = 80.
* **ZF (Magenta):** The line starts at approximately SER = 0.22 at Pilot Size = 0, decreases to around SER = 0.18 at Pilot Size = 20, fluctuates between 0.17 and 0.24 until Pilot Size = 80.
### Key Observations
* The Wiener algorithm consistently exhibits the lowest SER across all pilot sizes.
* The Capon and Kernel algorithms have similar SER performance, generally higher than Wiener and Wiener-CE.
* The Wiener-CE and ZF algorithms show comparable SER performance, falling between the Wiener and Capon/Kernel algorithms.
* All algorithms demonstrate a decreasing SER as pilot size increases, but the rate of decrease diminishes with larger pilot sizes.
* The SER curves tend to flatten out as the pilot size approaches 80, suggesting diminishing returns in performance improvement beyond that point.
### Interpretation
The data suggests that the Wiener algorithm is the most effective among the tested algorithms for reducing symbol error rate, particularly as the pilot size increases. The performance improvement gained by increasing the pilot size diminishes beyond a certain point (around Pilot Size = 60), indicating an optimal pilot size for each algorithm. The differences in SER between the algorithms highlight the trade-offs between complexity and performance. The Wiener algorithm's superior performance may come at the cost of increased computational complexity compared to simpler algorithms like ZF. The flattening of the curves at higher pilot sizes suggests that the algorithms are approaching their performance limits, and further increasing the pilot size would not yield significant improvements. This information is valuable for designing communication systems where minimizing symbol error rate is crucial, and it helps in selecting the appropriate algorithm and pilot size based on the specific application requirements.