# Technical Document Extraction: Line Graph Analysis
## 1. **Axis Labels and Titles**
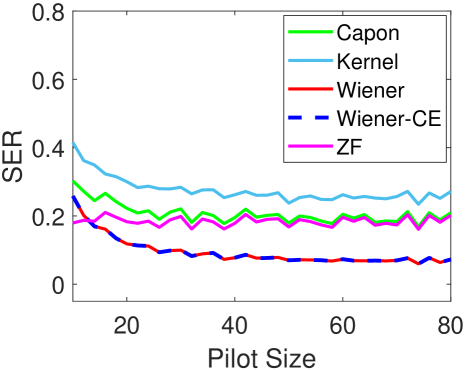
- **Y-Axis**: Labeled "SER" (Signal-to-Error Ratio), with values ranging from 0 to 0.8 in increments of 0.2.
- **X-Axis**: Labeled "Pilot Size", with values ranging from 20 to 80 in increments of 20.
## 2. **Legend and Color Mapping**
The legend is positioned in the **top-right corner** of the graph. It contains the following entries:
- **Green (Solid)**: Capon
- **Blue (Solid)**: Kernel
- **Red (Solid)**: Wiener
- **Dashed Blue**: Wiener-CE
- **Magenta (Solid)**: ZF
**Spatial Grounding**: The legend is anchored to the upper-right quadrant, ensuring clear association with the corresponding lines.
## 3. **Line Trends and Data Points**
### **Kernel (Blue Solid Line)**
- **Trend**: Starts at approximately **0.4** (x=20), decreases gradually to **0.25** (x=80), with minor fluctuations.
- **Key Data Points**:
- x=20: ~0.4
- x=40: ~0.3
- x=60: ~0.25
- x=80: ~0.25
### **Capon (Green Solid Line)**
- **Trend**: Begins at ~0.3 (x=20), fluctuates between **0.2** and **0.3** (x=20–60), then stabilizes near **0.2** (x=60–80).
- **Key Data Points**:
- x=20: ~0.3
- x=40: ~0.25
- x=60: ~0.2
- x=80: ~0.2
### **Wiener (Red Solid Line)**
- **Trend**: Starts at ~0.2 (x=20), dips sharply to ~0.05 (x=40), then stabilizes near **0.05** (x=60–80).
- **Key Data Points**:
- x=20: ~0.2
- x=40: ~0.05
- x=60: ~0.05
- x=80: ~0.05
### **Wiener-CE (Dashed Blue Line)**
- **Trend**: Mirrors the Wiener line but with slightly smoother transitions. Starts at ~0.2 (x=20), dips to ~0.05 (x=40), then stabilizes.
- **Key Data Points**:
- x=20: ~0.2
- x=40: ~0.05
- x=60: ~0.05
- x=80: ~0.05
### **ZF (Magenta Solid Line)**
- **Trend**: Begins at ~0.2 (x=20), fluctuates between **0.1** and **0.2** (x=20–60), then stabilizes near **0.2** (x=60–80).
- **Key Data Points**:
- x=20: ~0.2
- x=40: ~0.15
- x=60: ~0.2
- x=80: ~0.2
## 4. **Cross-Reference Verification**
- **Color Consistency**: All lines match their legend labels (e.g., red = Wiener, dashed blue = Wiener-CE).
- **Legend Placement**: Confirmed in the top-right corner, avoiding overlap with data lines.
## 5. **Component Isolation**
- **Header**: No explicit header text; title inferred from axis labels.
- **Main Chart**: Line graph with five distinct data series.
- **Footer**: No footer text; focus remains on the graph.
## 6. **Language and Textual Content**
- **Primary Language**: English.
- **No Additional Languages**: All text is in English.
## 7. **Summary of Key Observations**
- The **Kernel** line exhibits the highest initial SER but declines steadily.
- **Wiener** and **Wiener-CE** lines show the most significant drop, stabilizing at the lowest SER values.
- **Capon** and **ZF** lines maintain moderate SER levels with minor fluctuations.
- All lines converge toward lower SER values as Pilot Size increases, suggesting improved performance with larger pilot sizes.