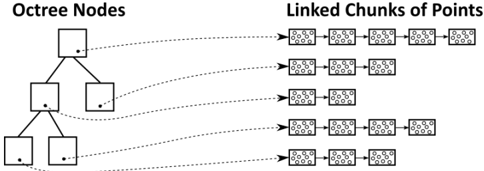
## Diagram: Octree Nodes and Linked Chunks of Points
### Overview
The image depicts a conceptual diagram illustrating the relationship between **Octree Nodes** (a hierarchical tree structure) and **Linked Chunks of Points** (spatial data groupings). The diagram uses arrows to show directional relationships between nodes and chunks.
### Components/Axes
- **Left Side**:
- **Octree Nodes**: A hierarchical tree structure with 7 nodes (represented as squares).
- Root node (topmost square).
- Two child nodes per parent node (e.g., root splits into two nodes, each splitting into two more, etc.).
- Nodes are labeled with black dots (likely indicating data points or node identifiers).
- **Arrows**: Dotted lines connect octree nodes to the right side, indicating associations.
- **Right Side**:
- **Linked Chunks of Points**: 10 rectangular blocks, each containing multiple small circles (representing points).
- **Arrows**: Solid arrows link octree nodes to specific chunks, suggesting a mapping or dependency.
### Detailed Analysis
- **Octree Structure**:
- The tree has 3 levels:
1. Root node (level 0).
2. Two nodes at level 1.
3. Four nodes at level 2 (total 7 nodes).
- No numerical labels or identifiers are present on nodes.
- **Linked Chunks**:
- Chunks vary in size (number of circles):
- 5 chunks contain 4 circles (smallest).
- 3 chunks contain 6 circles.
- 2 chunks contain 8 circles (largest).
- No explicit numerical labels or identifiers for chunks.
- **Relationships**:
- Each octree node connects to 1–2 chunks via arrows.
- Root node connects to 2 chunks.
- Level 1 nodes connect to 1–2 chunks each.
- Level 2 nodes connect to 1 chunk each.
### Key Observations
- The diagram emphasizes hierarchical decomposition (octree) and spatial partitioning (chunks).
- No numerical data or trends are provided (e.g., no axis scales, values, or legends).
- Arrows suggest a many-to-many relationship between nodes and chunks.
### Interpretation
This diagram likely represents a spatial indexing system where:
1. **Octree Nodes** partition space recursively (e.g., for 3D modeling, collision detection, or ray tracing).
2. **Linked Chunks of Points** group spatial data (e.g., vertices, particles) associated with specific octree regions.
3. The lack of numerical values implies this is a conceptual illustration, not a data-driven visualization.
The structure suggests that as the octree depth increases (more nodes), the spatial resolution of chunks increases (more points per chunk). This could optimize queries or computations in applications like computer graphics or machine learning (e.g., point cloud processing).