## Diagram: Convolutional Neural Network Layer Visualization
### Overview
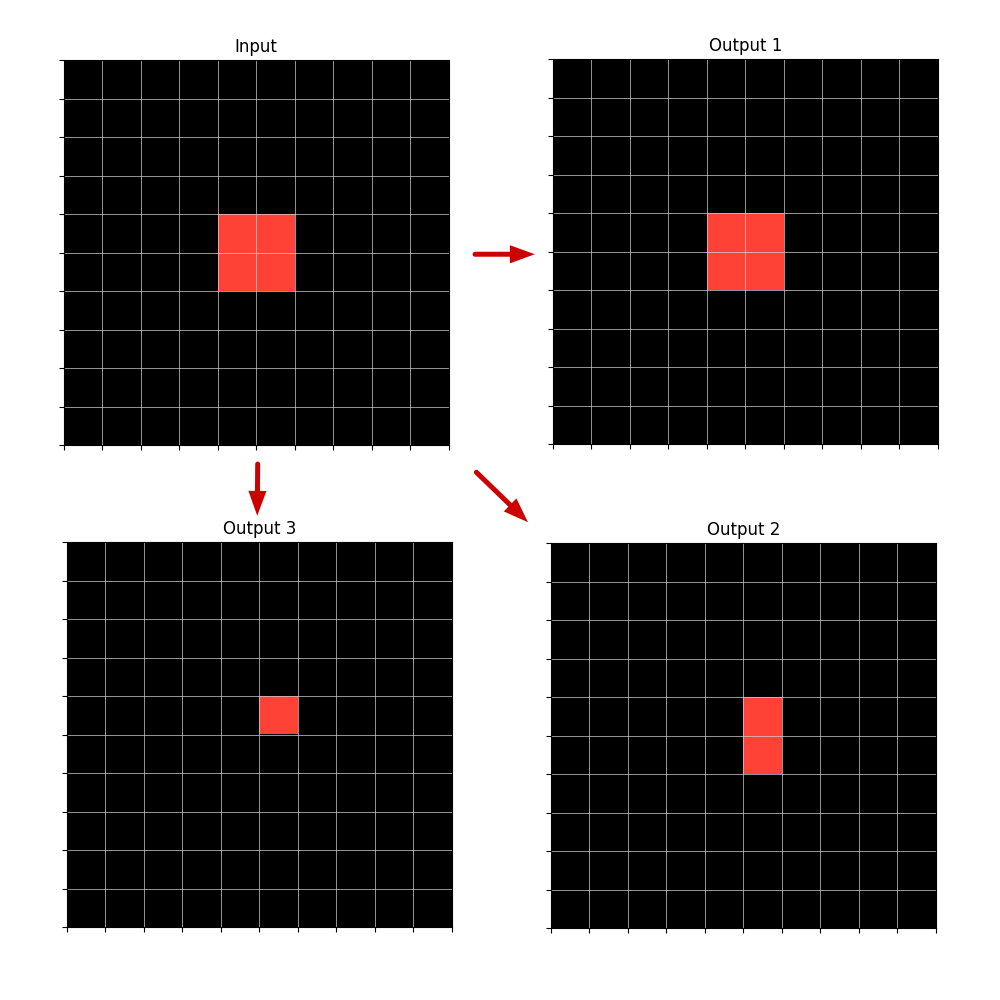
The image depicts a simplified visualization of a convolutional neural network layer. It shows an "Input" grid with a highlighted region, and three "Output" grids, each representing a different transformation of the input. Arrows indicate the flow of data from the input to each output.
### Components/Axes
* **Input:** A 10x10 grid with a 2x2 region highlighted in the center.
* **Output 1:** A 10x10 grid with a 2x2 region highlighted in the center.
* **Output 2:** A 10x10 grid with a 1x3 region highlighted in the center.
* **Output 3:** A 10x10 grid with a 1x1 region highlighted in the center.
* **Arrows:** Arrows indicate the flow from the "Input" to "Output 1", "Output 2", and "Output 3".
### Detailed Analysis
* **Input:** The input grid is 10x10, with a 2x2 square highlighted in the center. The highlighted region spans rows 4-5 and columns 4-5.
* **Output 1:** The output grid is 10x10, with a 2x2 square highlighted in the center. The highlighted region spans rows 4-5 and columns 4-5.
* **Output 2:** The output grid is 10x10, with a 1x3 rectangle highlighted in the center. The highlighted region spans rows 4-6 and column 4.
* **Output 3:** The output grid is 10x10, with a 1x1 square highlighted in the center. The highlighted region spans row 5 and column 5.
### Key Observations
* The "Input" and "Output 1" have the same highlighted region size and position.
* "Output 2" has a vertically elongated highlighted region.
* "Output 3" has a single-cell highlighted region.
* The arrows indicate a parallel processing flow from the input to the three outputs.
### Interpretation
The diagram illustrates how a convolutional layer might transform an input feature map into multiple output feature maps. Each output represents a different filter applied to the input. "Output 1" could represent an identity filter, preserving the original feature. "Output 2" could represent a vertical edge detection filter, and "Output 3" could represent a point detection filter. The diagram demonstrates the concept of feature extraction and transformation in convolutional neural networks.