## Diagram: Input-to-Output Transformation Flow
### Overview
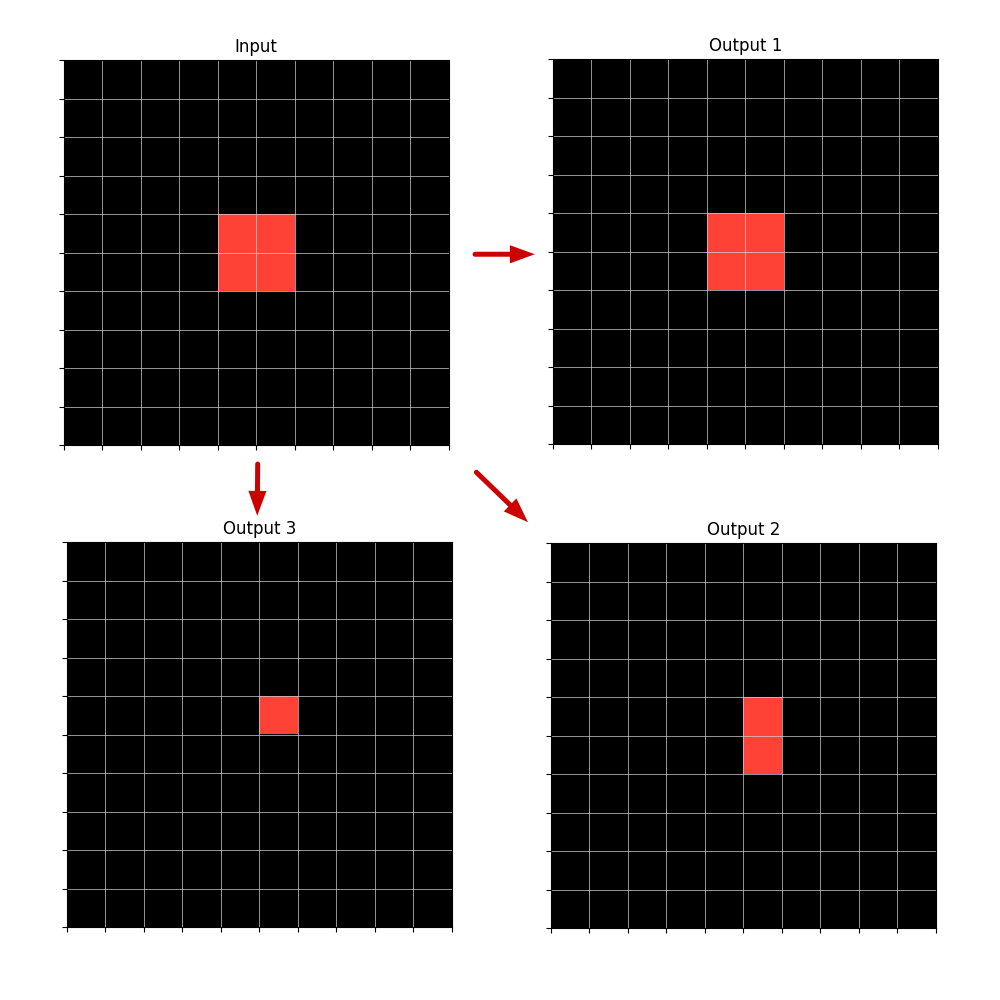
The image depicts a four-quadrant grid-based diagram illustrating a transformation process. The top-left quadrant is labeled "Input," while the remaining three quadrants are labeled "Output 1," "Output 2," and "Output 3." Red arrows indicate directional relationships between these components. Each quadrant contains a 10x10 grid with a centrally positioned red square.
### Components/Axes
1. **Grid Structure**:
- All quadrants share identical grid dimensions (10 rows × 10 columns)
- Grid lines are white on a black background
- Coordinate system: Cartesian-like with equal spacing between grid lines
2. **Key Elements**:
- **Input**: Top-left quadrant with a 3x3 red square centered at (5,5) grid coordinates
- **Output 1**: Top-right quadrant with identical 3x3 red square at (5,5)
- **Output 2**: Bottom-right quadrant with 3x3 red square vertically stretched to 3x6 (rows 4-6, column 5)
- **Output 3**: Bottom-left quadrant with 3x3 red square vertically compressed to 1x3 (row 5, columns 4-6)
3. **Arrows**:
- Red arrows connect "Input" to all three outputs
- Arrow thickness: 2px
- Arrowhead size: 5px
### Detailed Analysis
- **Positional Consistency**: All outputs maintain the central position of the red square relative to their respective grids
- **Dimensional Variations**:
- Output 2: Vertical expansion (height doubled from 3 to 6 units)
- Output 3: Vertical compression (height reduced from 3 to 1 unit)
- Output 1: No dimensional changes
- **Spatial Relationships**:
- Output 1 mirrors Input exactly
- Output 2 extends downward from Input's position
- Output 3 contracts upward from Input's position
### Key Observations
1. **Invariant Positioning**: The red square's center remains at grid coordinates (5,5) across all outputs despite dimensional changes
2. **Directional Flow**: Arrows suggest a one-to-many transformation process from Input to multiple outputs
3. **Structural Preservation**: Grid dimensions remain constant across all quadrants, emphasizing positional rather than spatial transformations
### Interpretation
This diagram appears to represent a data processing or transformation pipeline where:
- The Input serves as a base reference point
- Output 1 represents an identity transformation (no change)
- Output 2 demonstrates vertical expansion while maintaining horizontal alignment
- Output 3 shows vertical compression with horizontal centering
The consistent central positioning across all outputs suggests that the transformation process preserves a core reference point while allowing dimensional modifications. This could symbolize:
1. Feature extraction maintaining key attributes
2. Data normalization processes
3. Dimensionality reduction techniques
4. Signal processing with preserved central frequency
The absence of numerical values or explicit scaling factors leaves the exact nature of transformations ambiguous, but the visual consistency implies a controlled, rule-based transformation system.